Standard Deviation
Student Summary
We can describe the variability of a distribution using the standard deviation. The standard deviation is a measure of variability that is calculated using a method that is similar to the one used to calculate the MAD, or mean absolute deviation.
A deeper understanding of the importance of standard deviation as a measure of variability will come with a deeper study of statistics. For now, know that the standard deviation is mathematically important and will be used as the appropriate measure of variability when the mean is an appropriate measure of center.
Like the MAD, the standard deviation is large when the data set is more spread out, and the standard deviation is small when the variability is small. The intuition you gained about MAD will also work for the standard deviation.
Visual / Anchor Chart

Standards
HSS-ID.A.1
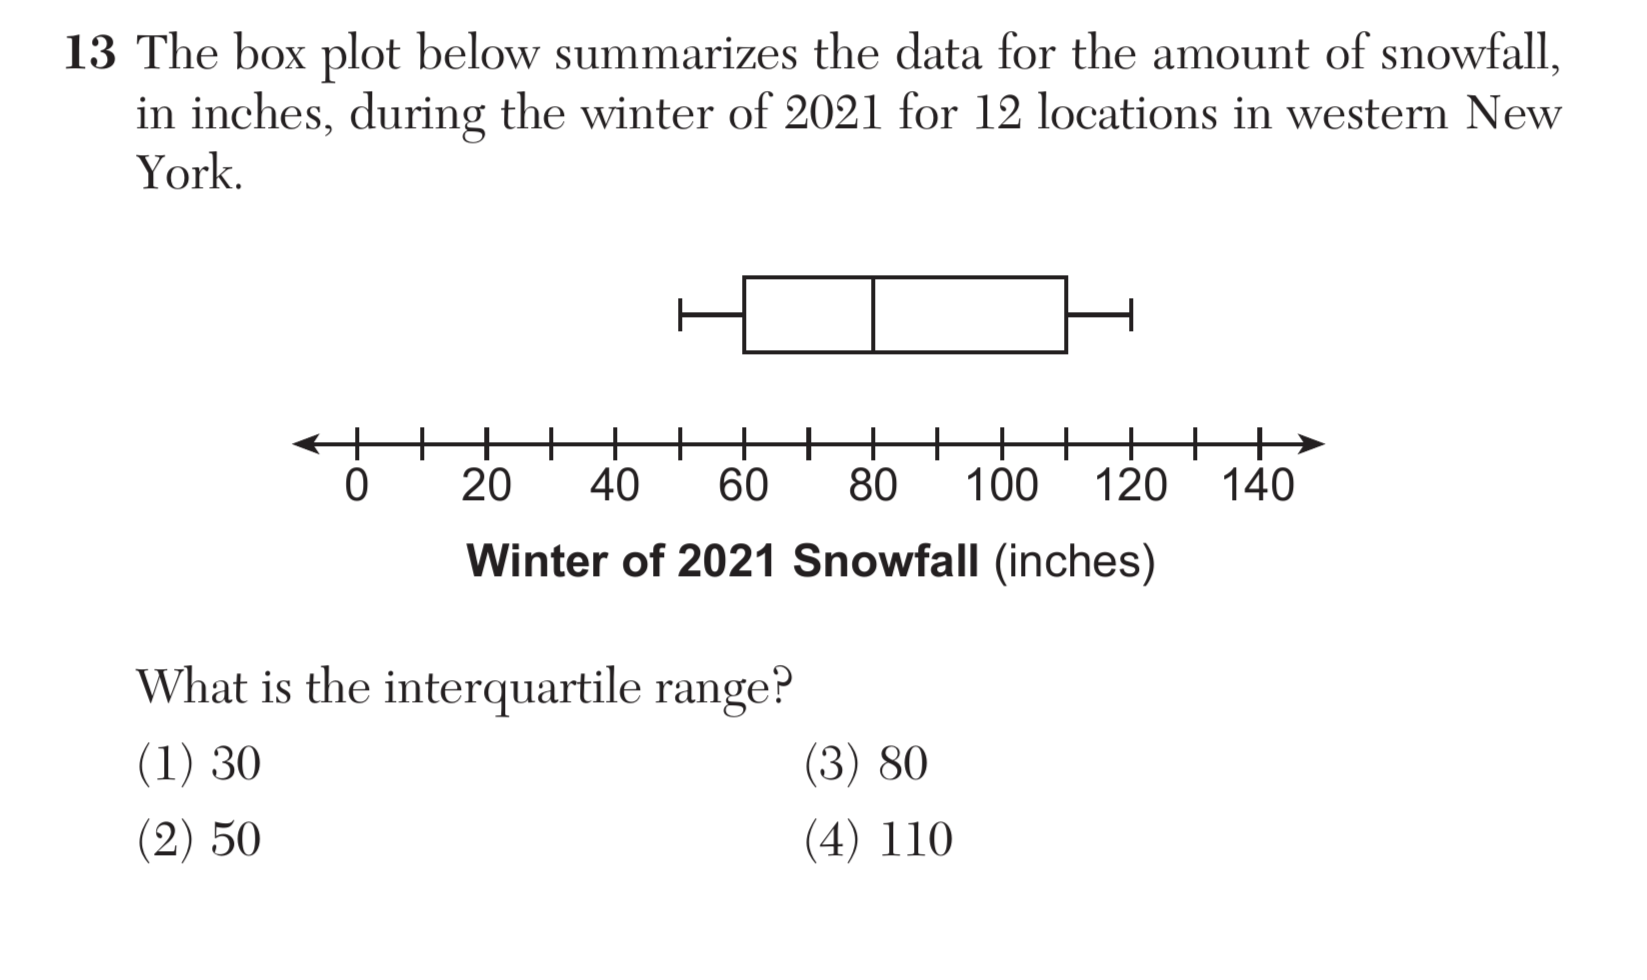
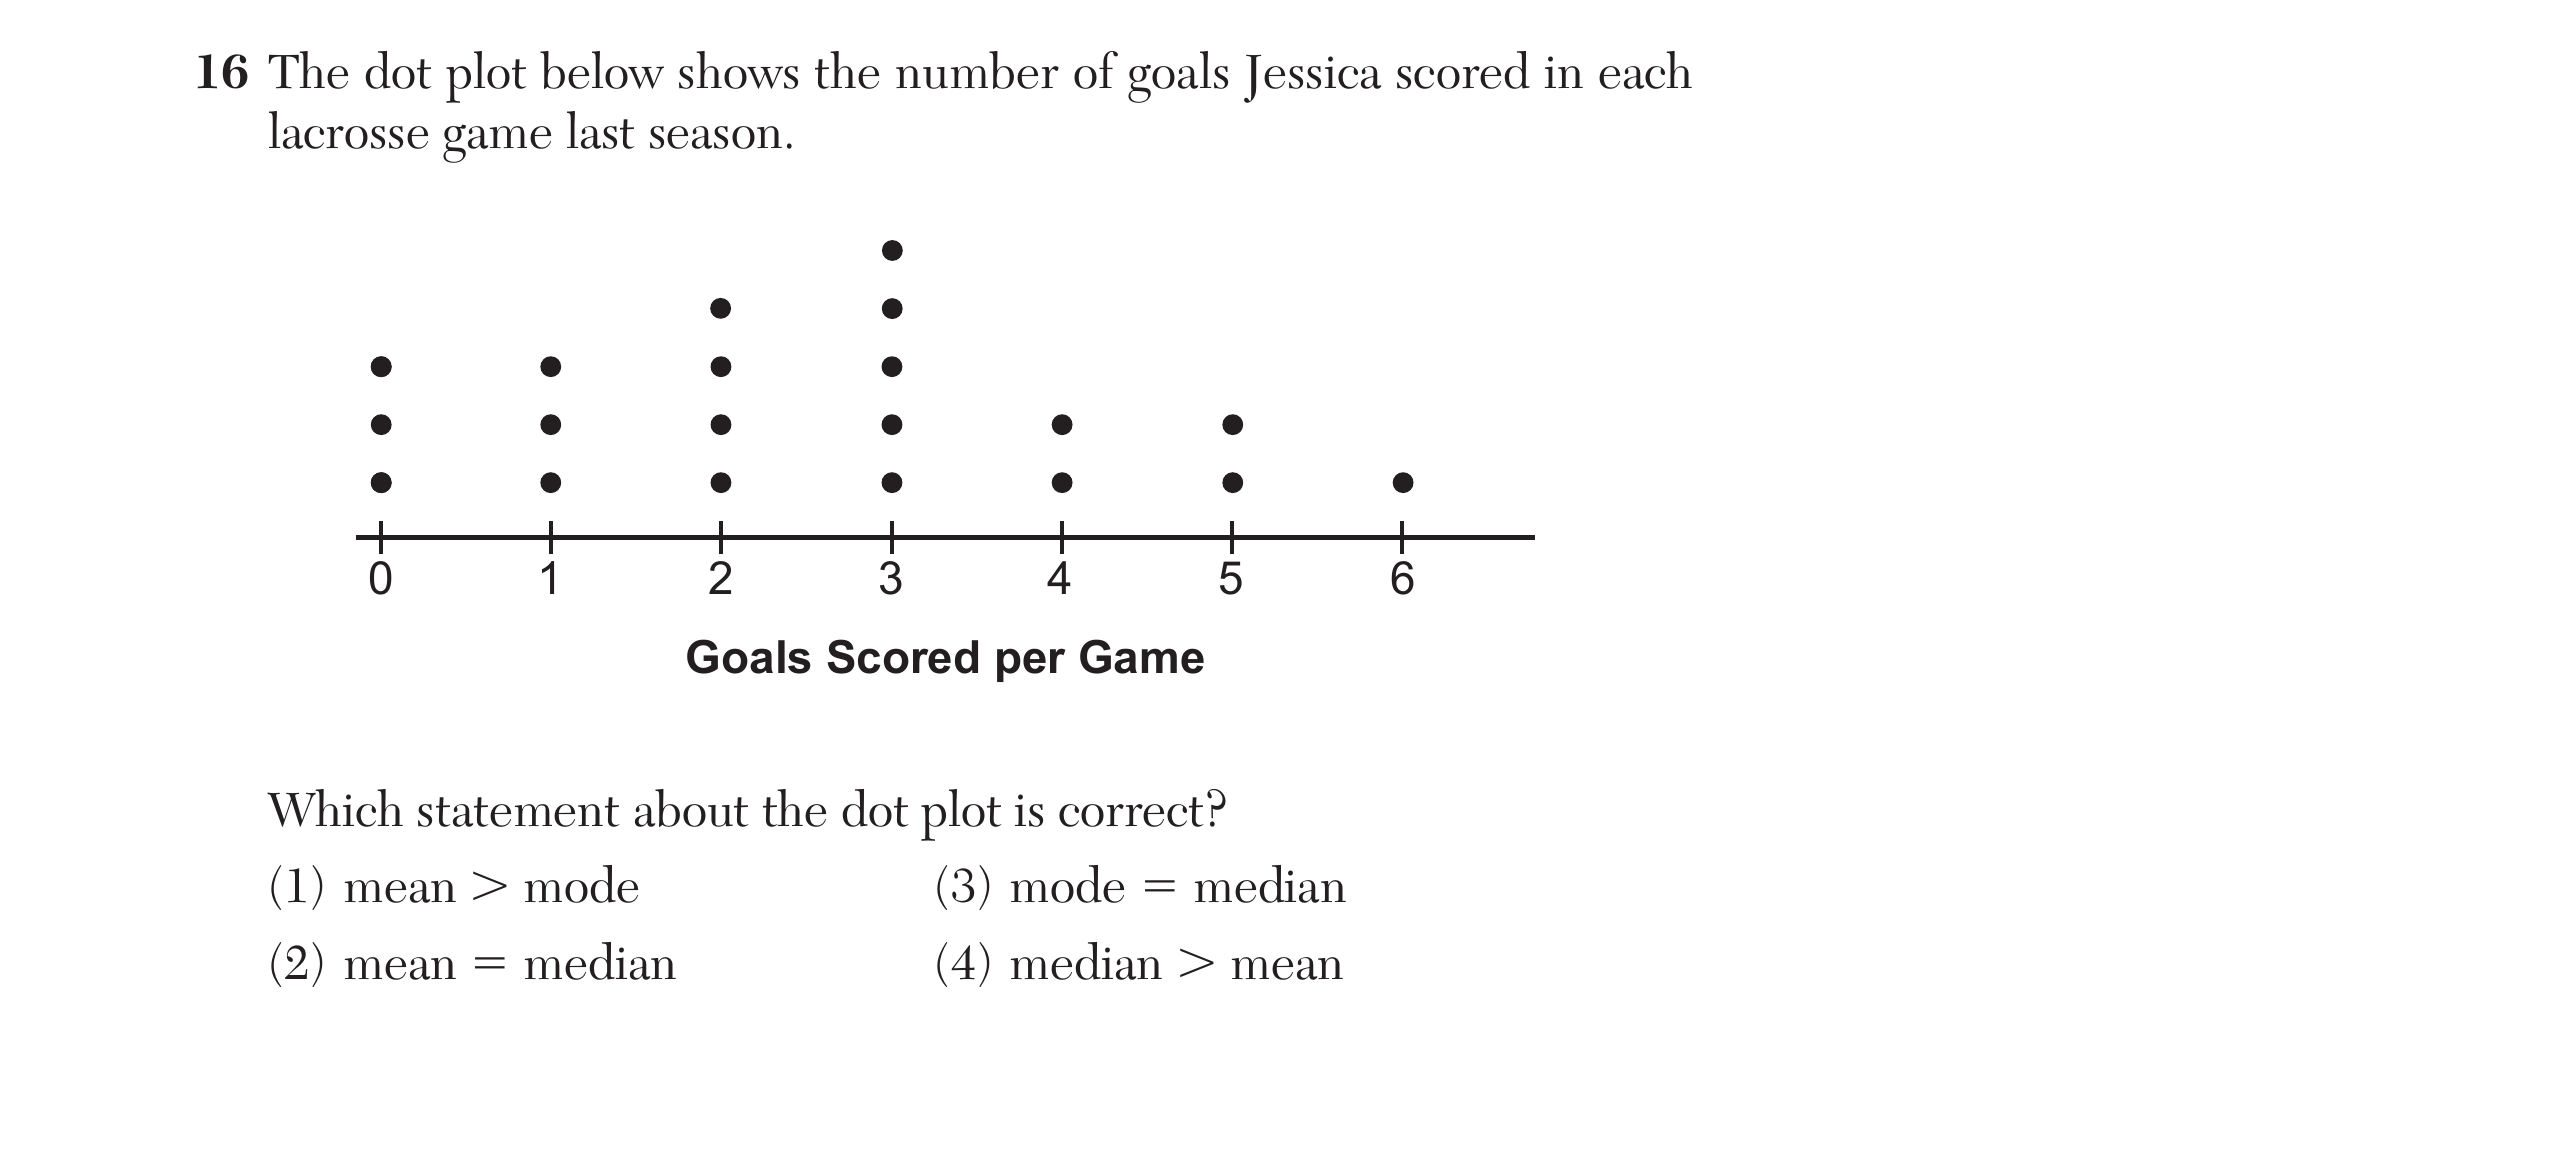
Represent data with plots on the real number line (dot plots, histograms, and box plots).
HSS-ID.A.26 questions
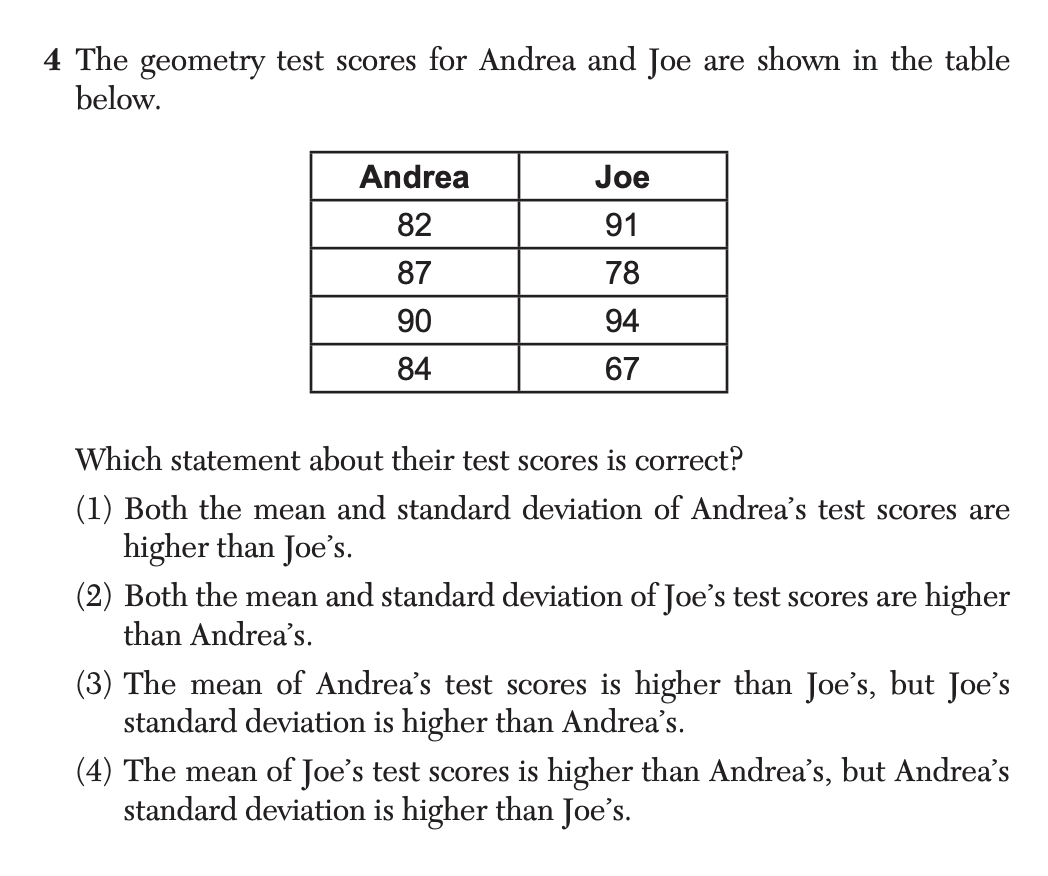
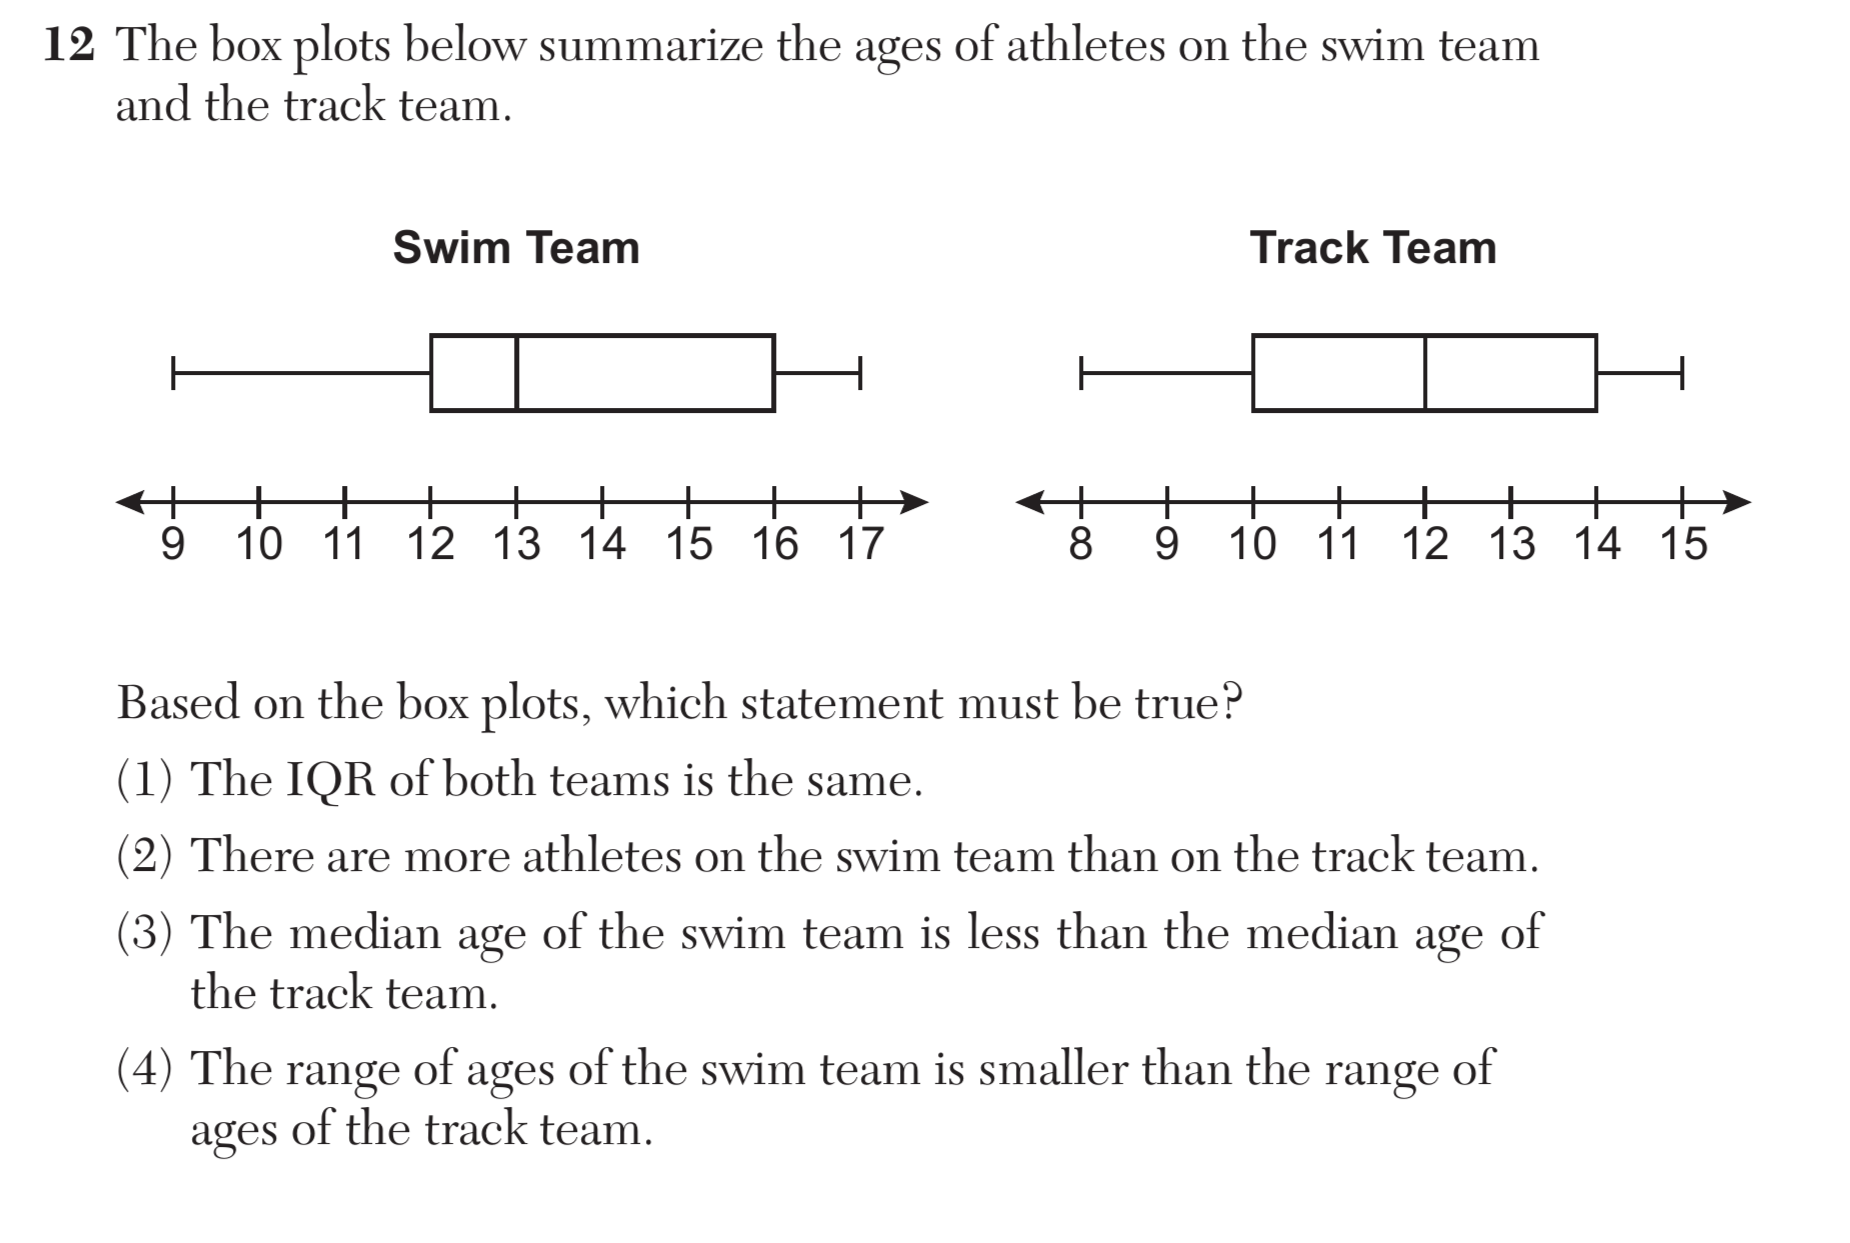
Use statistics appropriate to the shape of the data distribution to compare center (median, mean) and spread (inter-quartile range, sample standard deviation) of two or more different data sets.
HSS-ID.A.26 questions
Use statistics appropriate to the shape of the data distribution to compare center (median, mean) and spread (inter-quartile range, sample standard deviation) of two or more different data sets.
HSS-ID.A.3
Interpret differences in shape, center, and spread in the context of the data sets, accounting for possible effects of extreme data points (outliers).