Analyzing Graphs
Student Summary
Graphs are useful for comparing relationships. Here are two graphs representing the amount of caffeine in Person A and Person B, in milligrams, at different times, measured hourly, after an initial measurement.
A
B
The graphs reveal interesting information about the caffeine in each person over time:
- At the initial measurement, Person A has more caffeine (200 milligrams) than Person B (100 milligrams).
- The caffeine in Person A's body decreases faster. It went from 200 to 160 milligrams in an hour. Because 160 is 108 (or 54) of 200, the growth factor is 54.
- The caffeine in Person B's body went from 100 to about 90 milligrams, so that growth factor is about 109. This means that after each hour, a larger fraction of caffeine stays in Person B than in Person A.
- Even though Person A started out with twice as much caffeine, because of the growth factor, Person A had less caffeine than Person B after 6 hours.
Visual / Anchor Chart

Standards
8.EE.1
Know and apply the properties of integer exponents to generate equivalent numerical expressions.
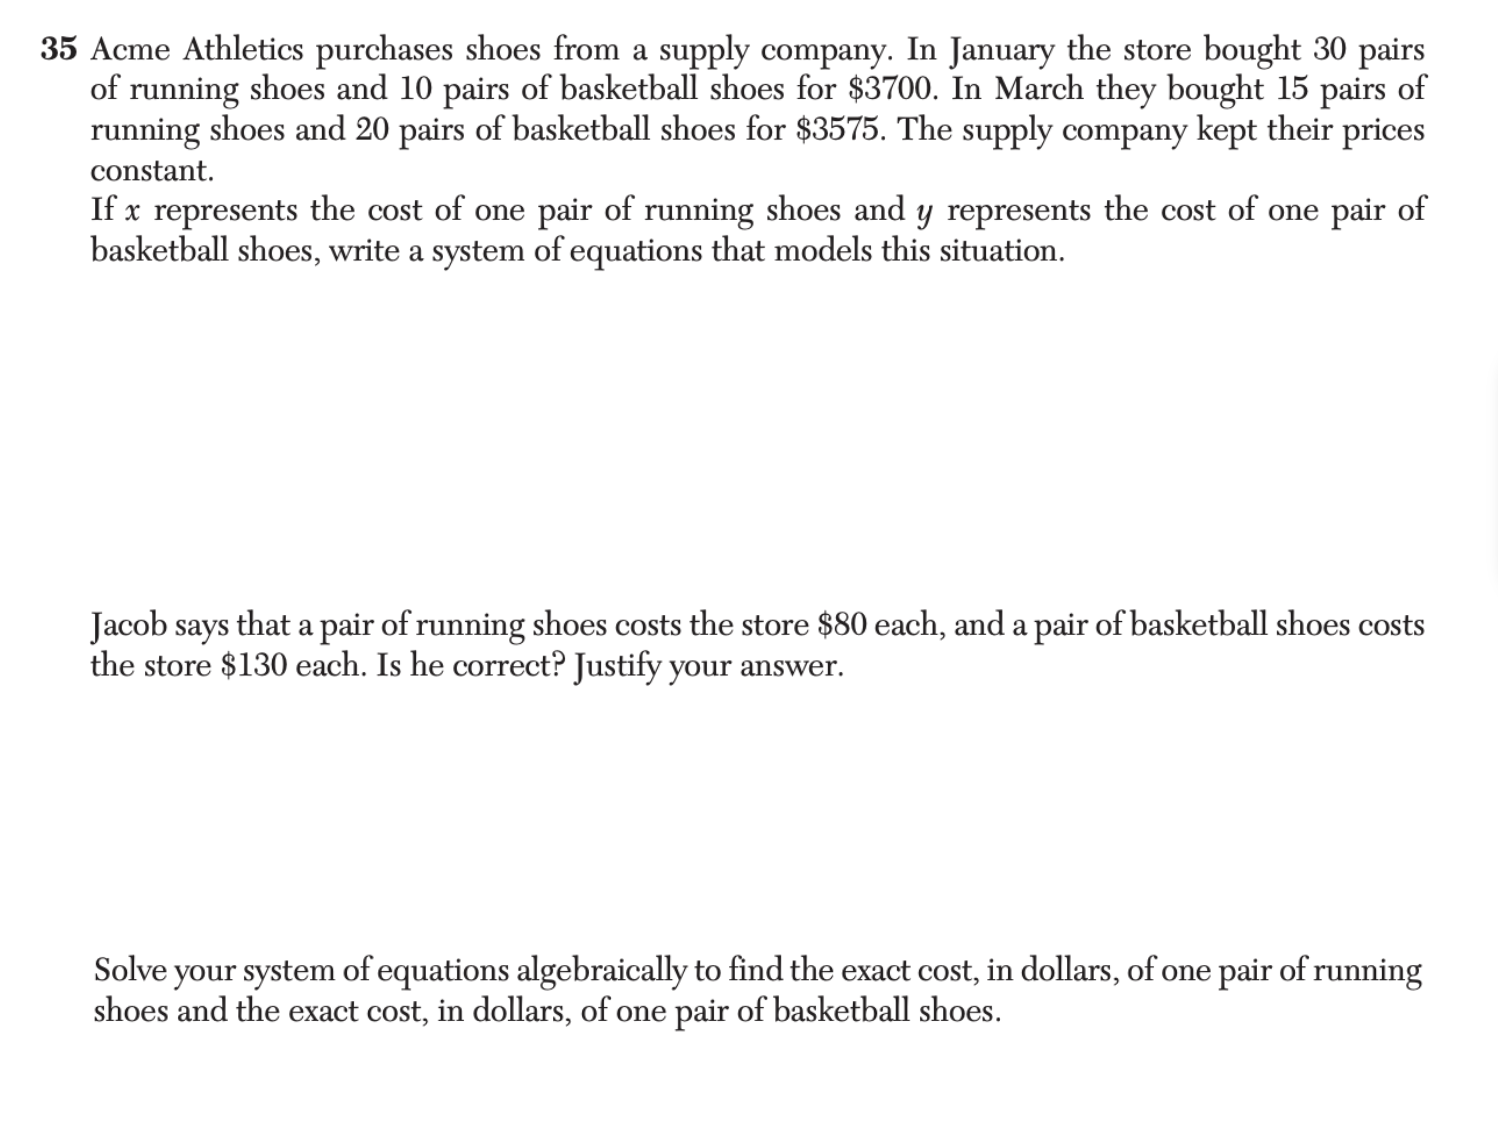
A-CED.21 question
Create equations and linear inequalities in two variables to represent a real-world context.
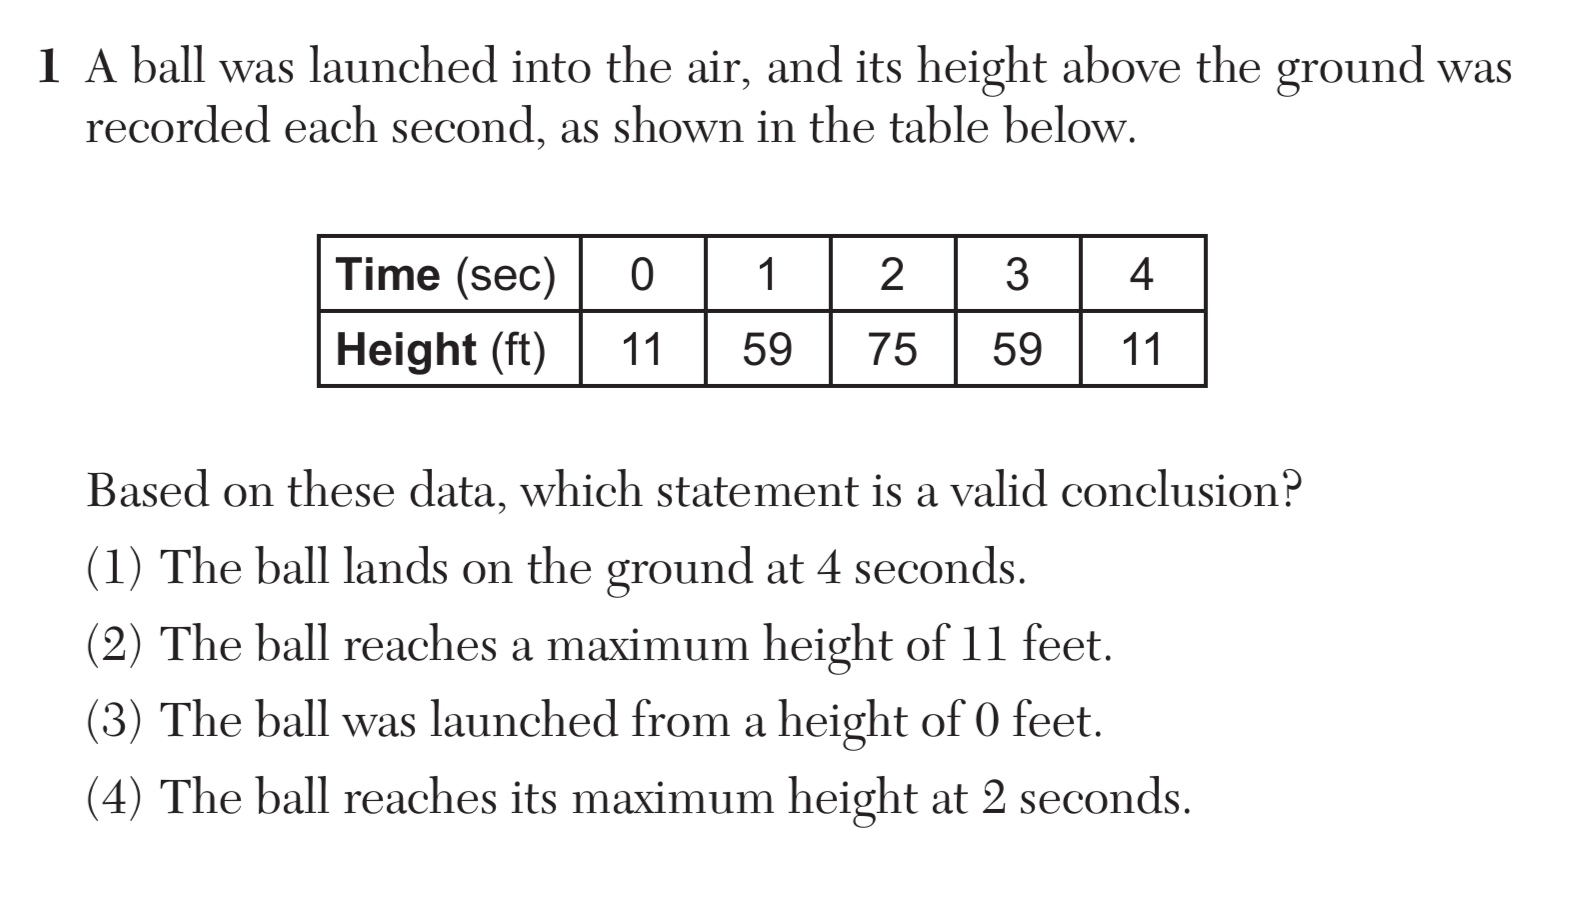
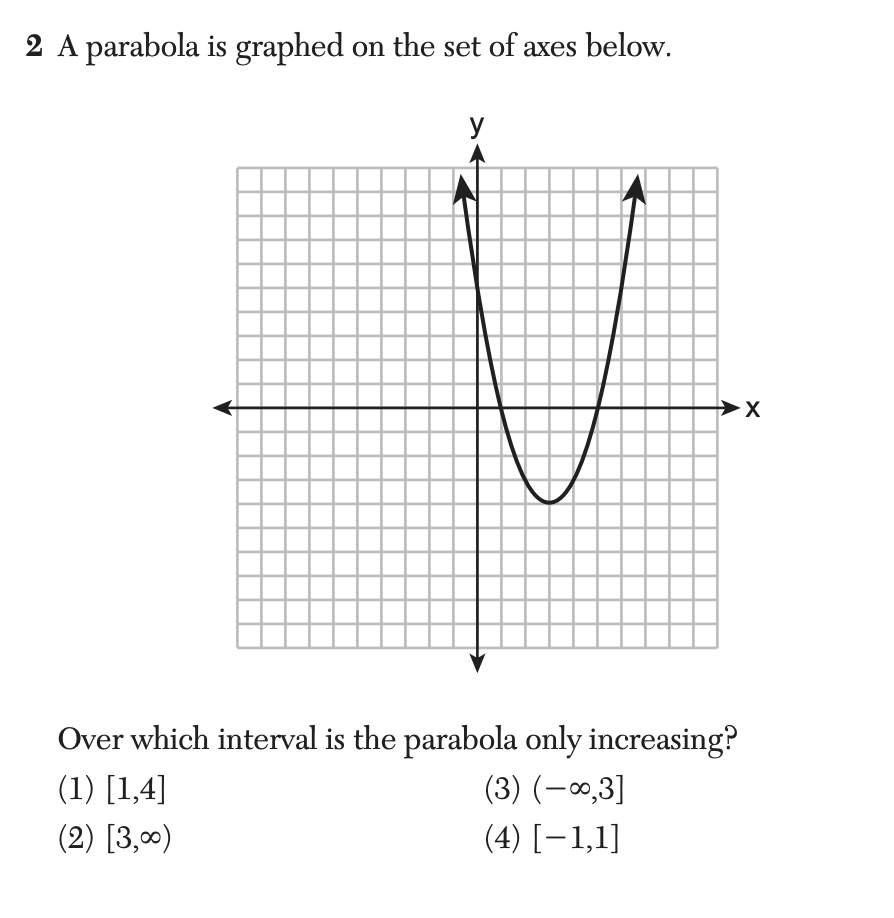
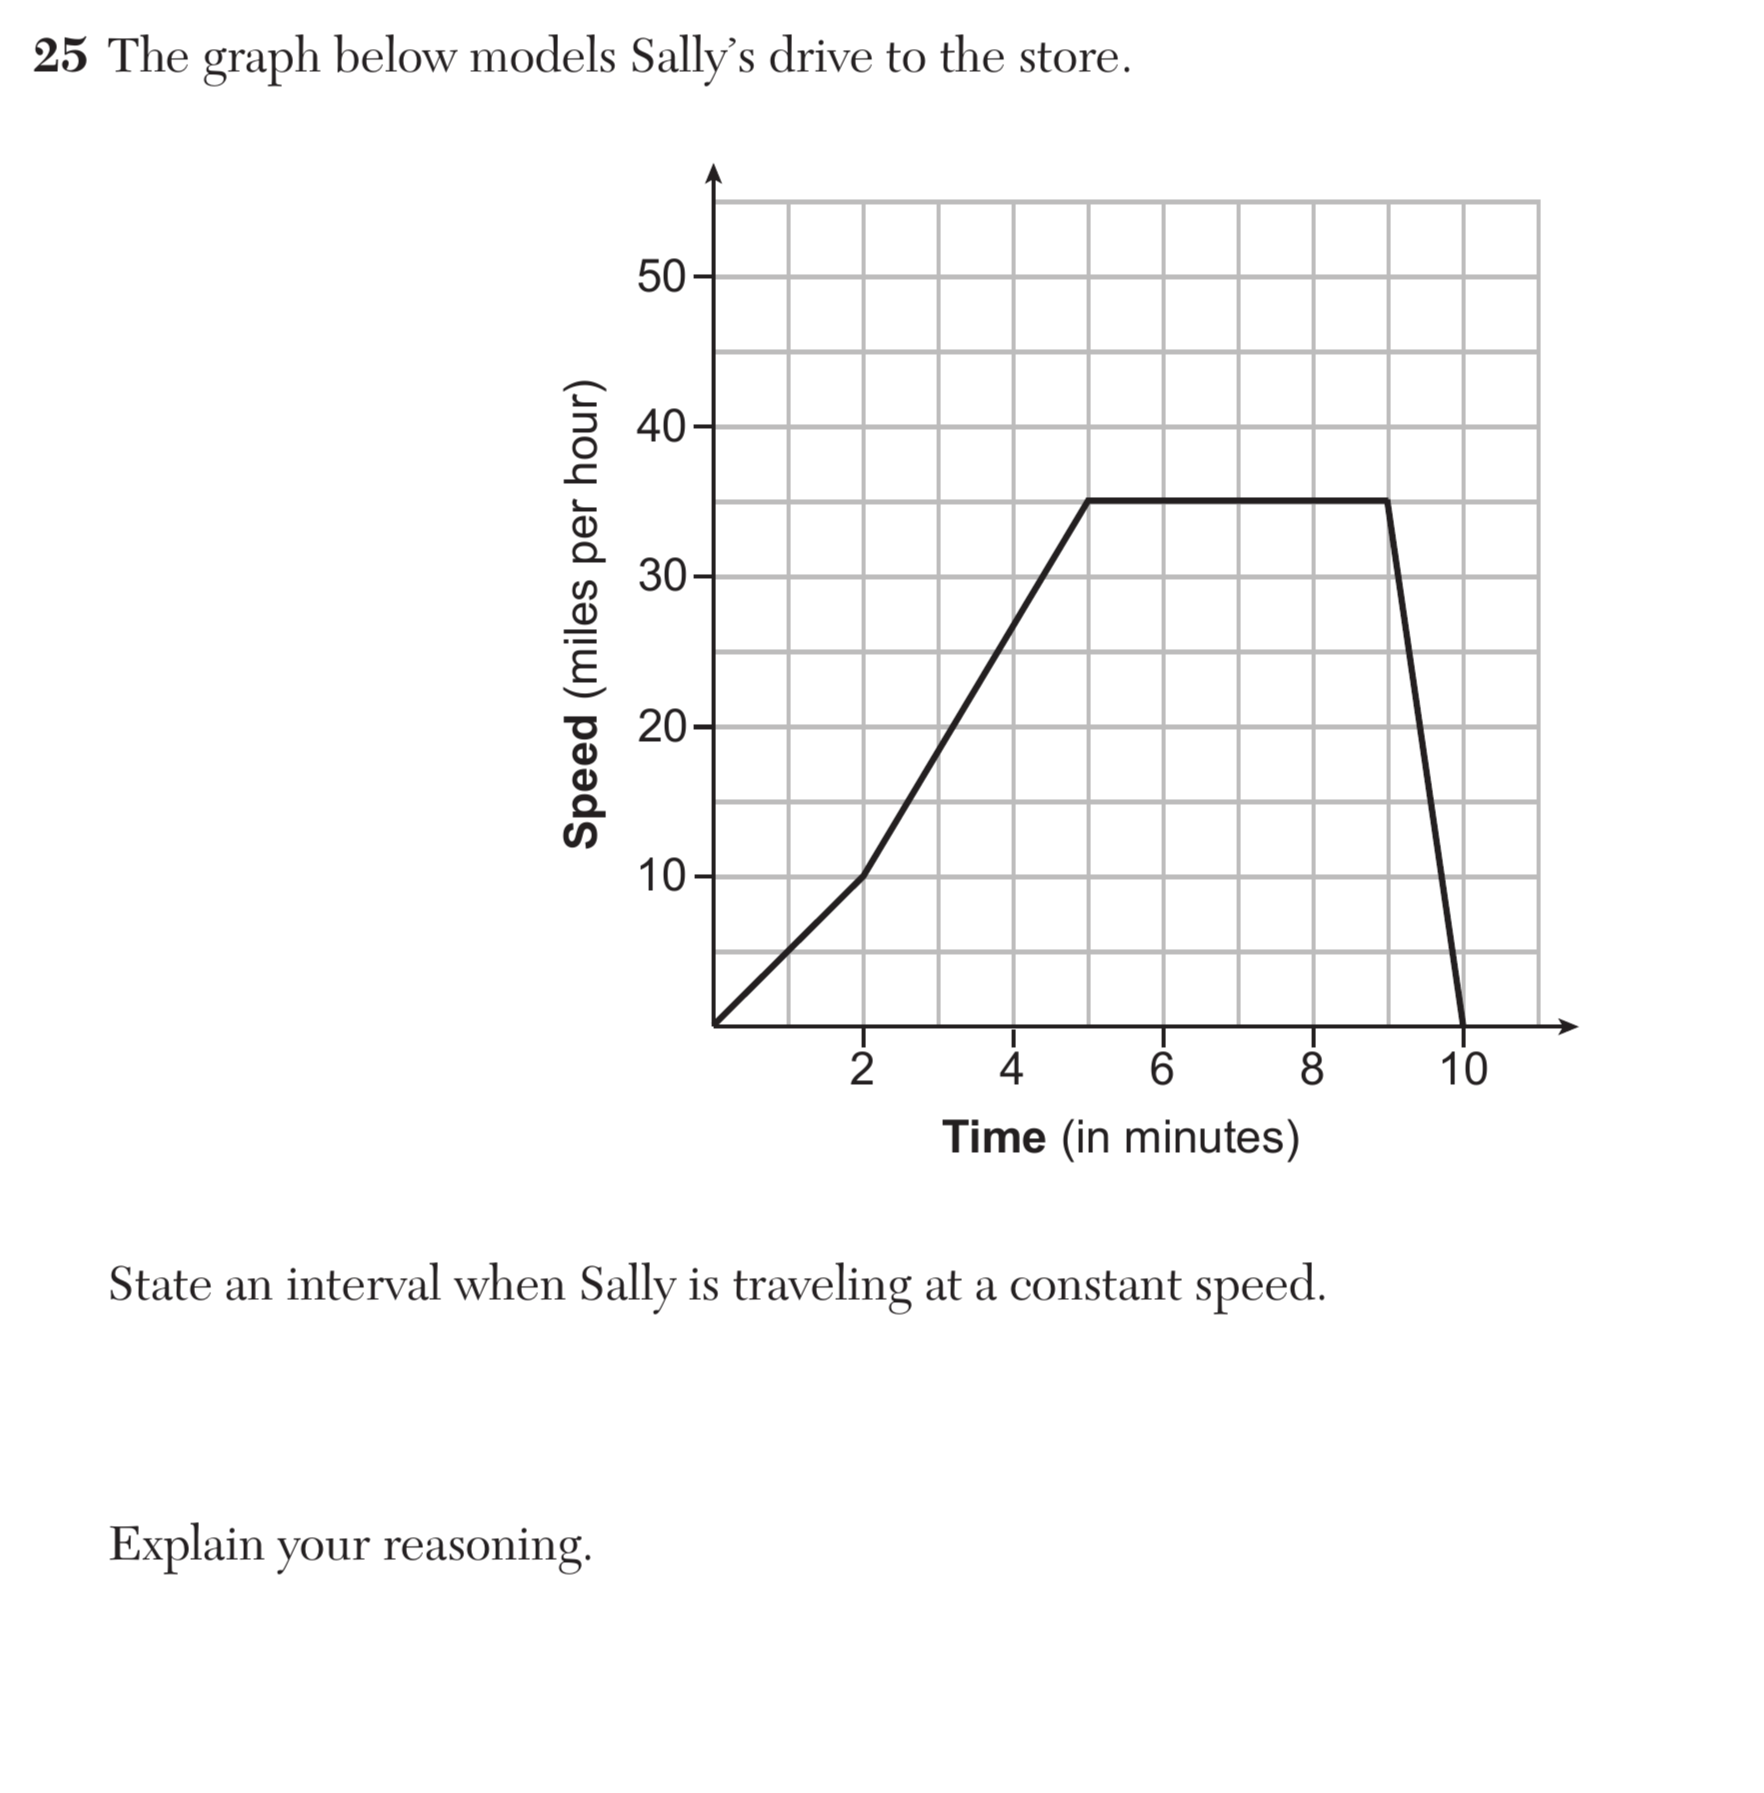
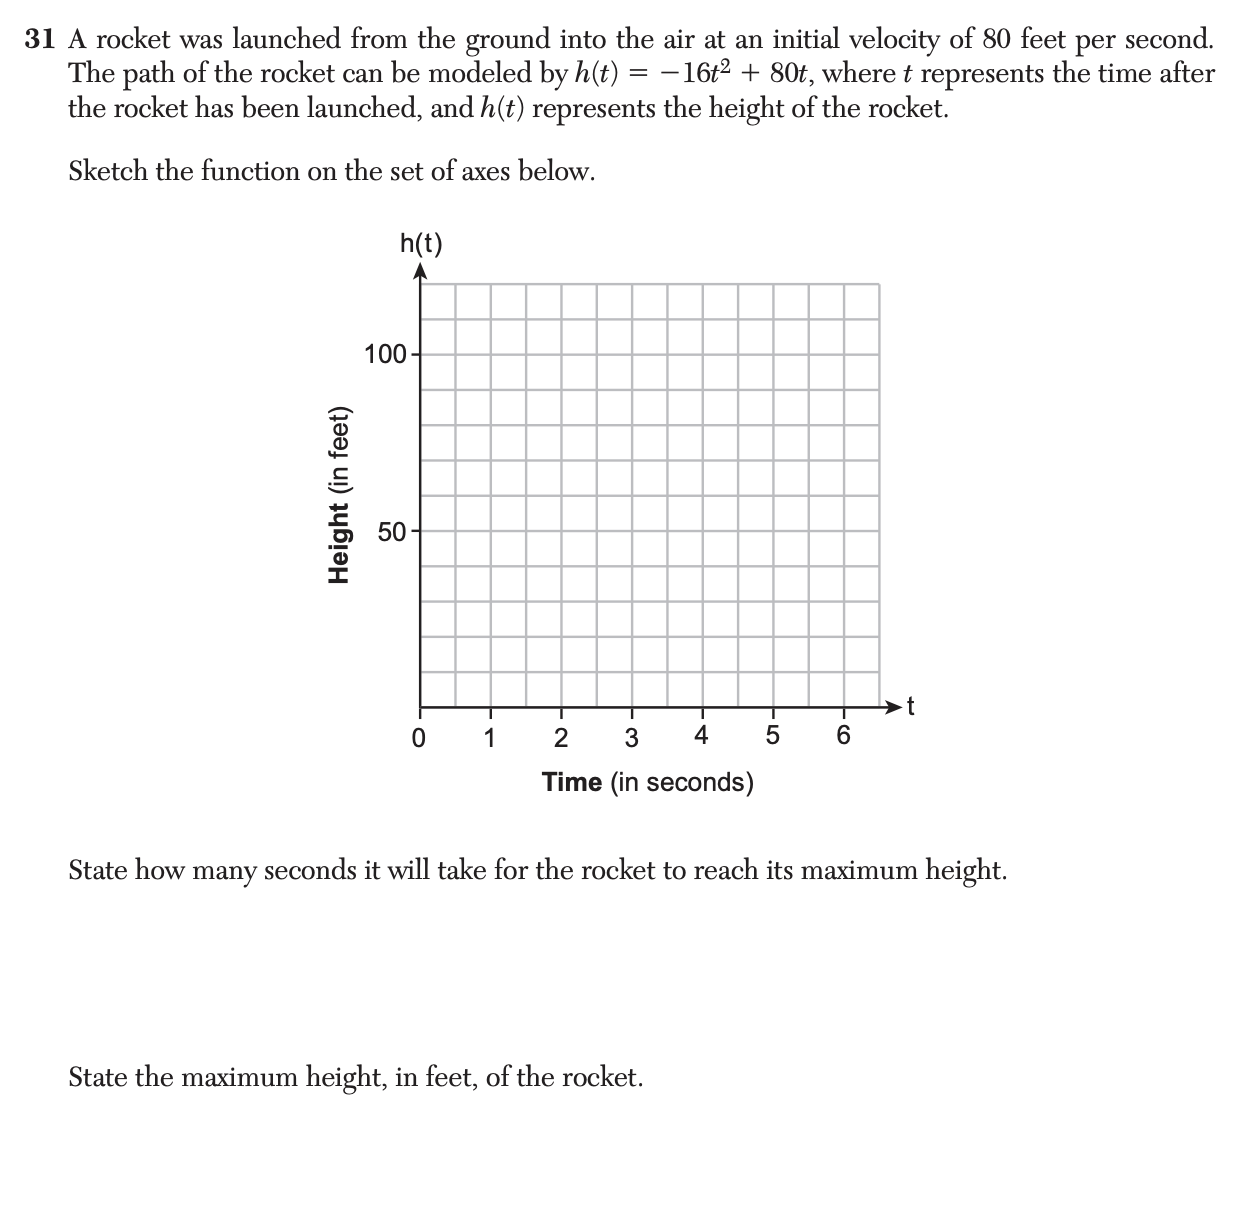
F-IF.45 questions
For a function that models a relationship between two quantities: i) interpret key features of graphs and tables in terms of the quantities; and ii) sketch graphs showing key features given a verbal description of the relationship.
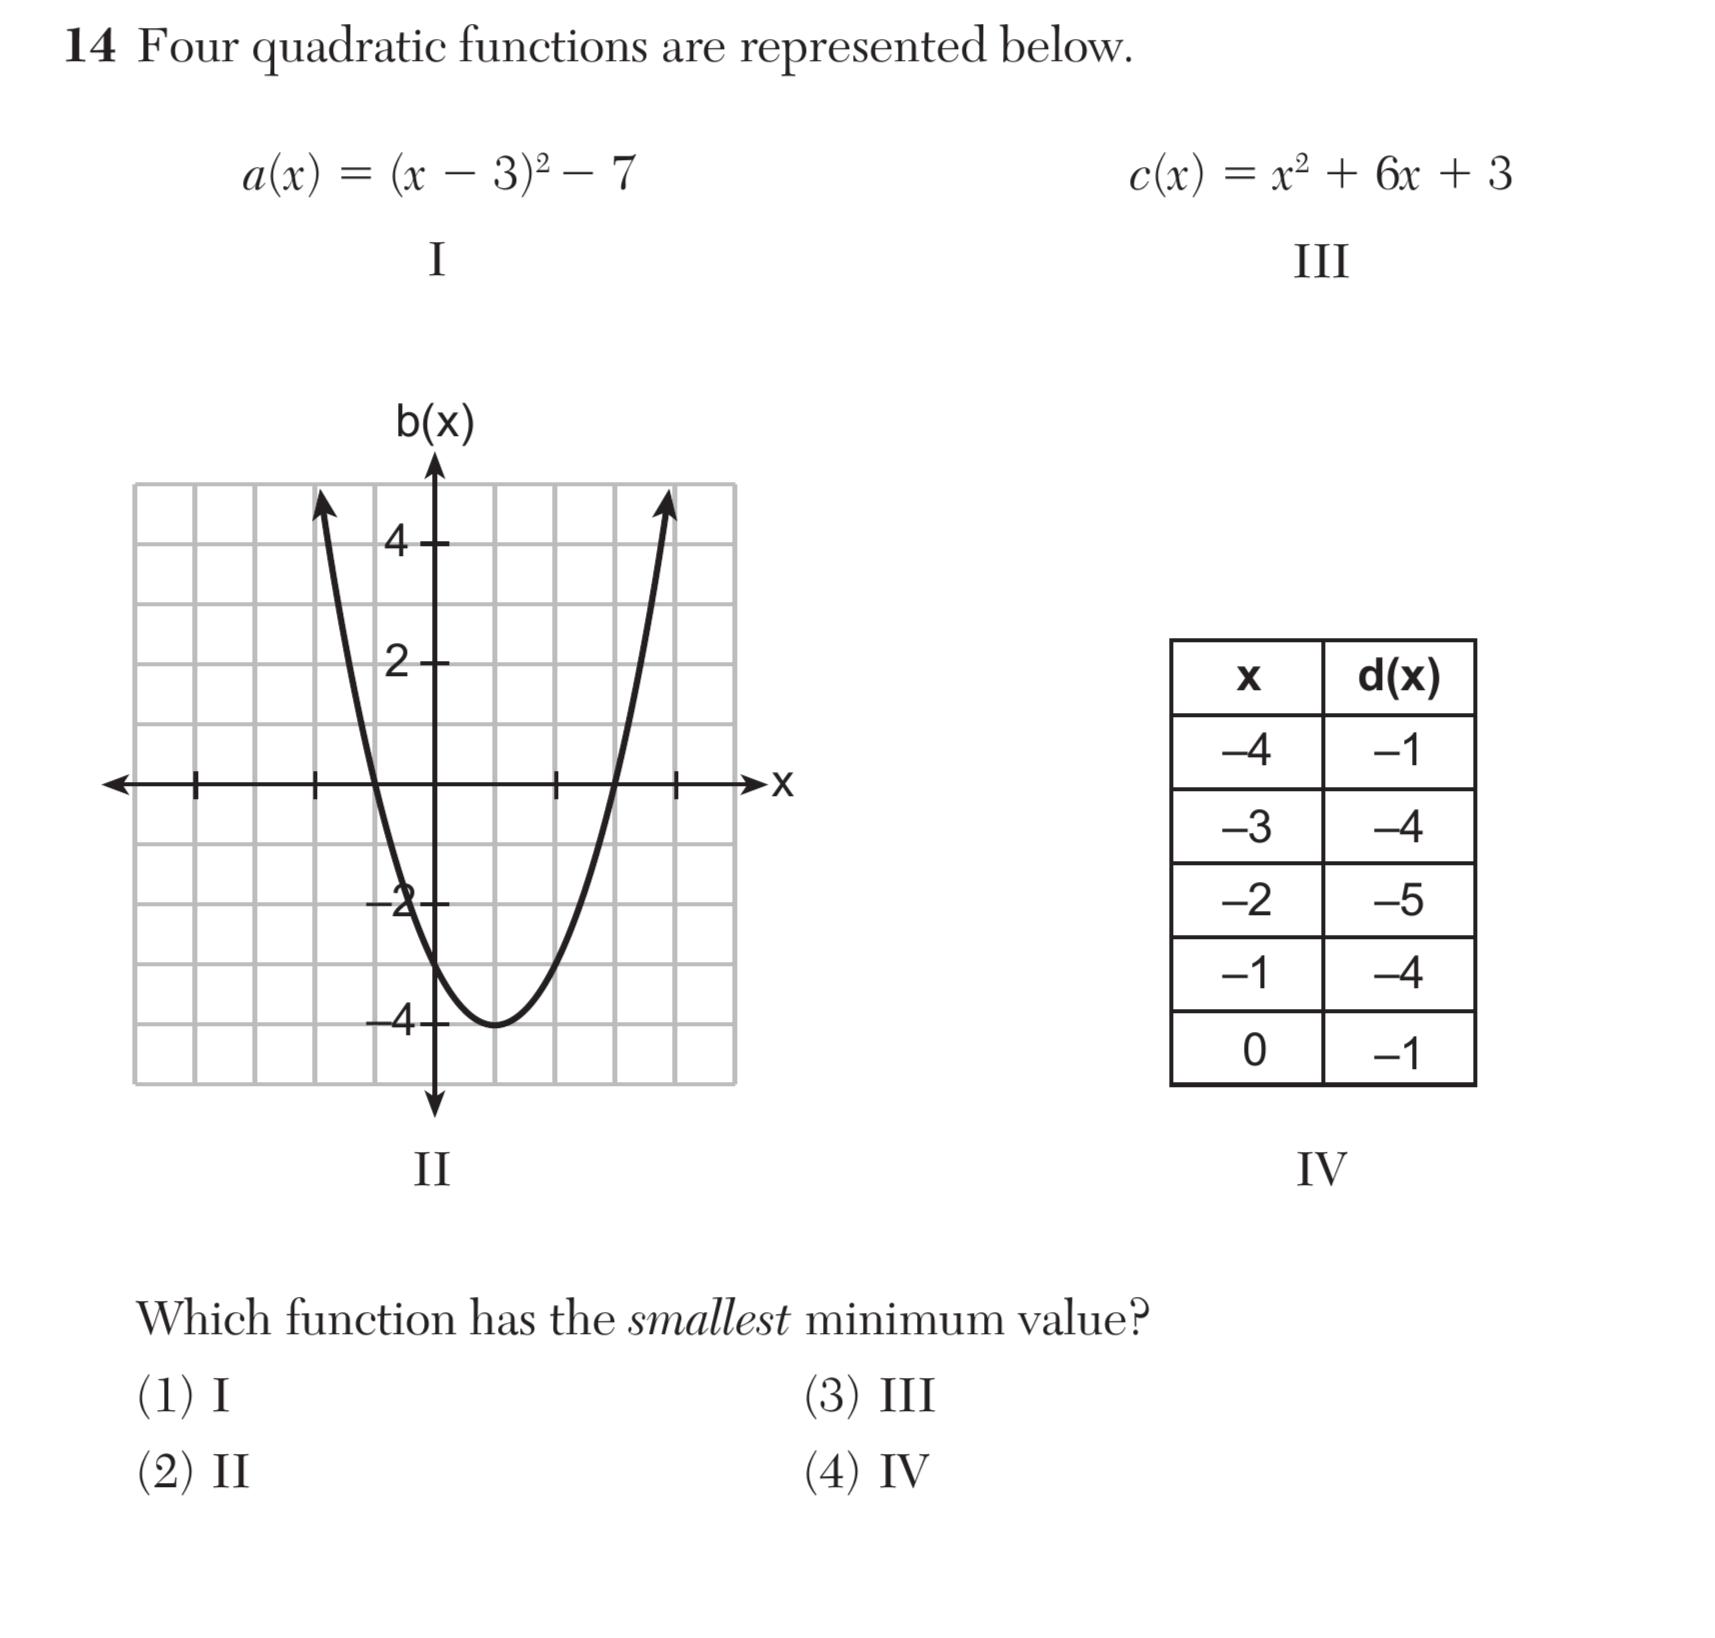
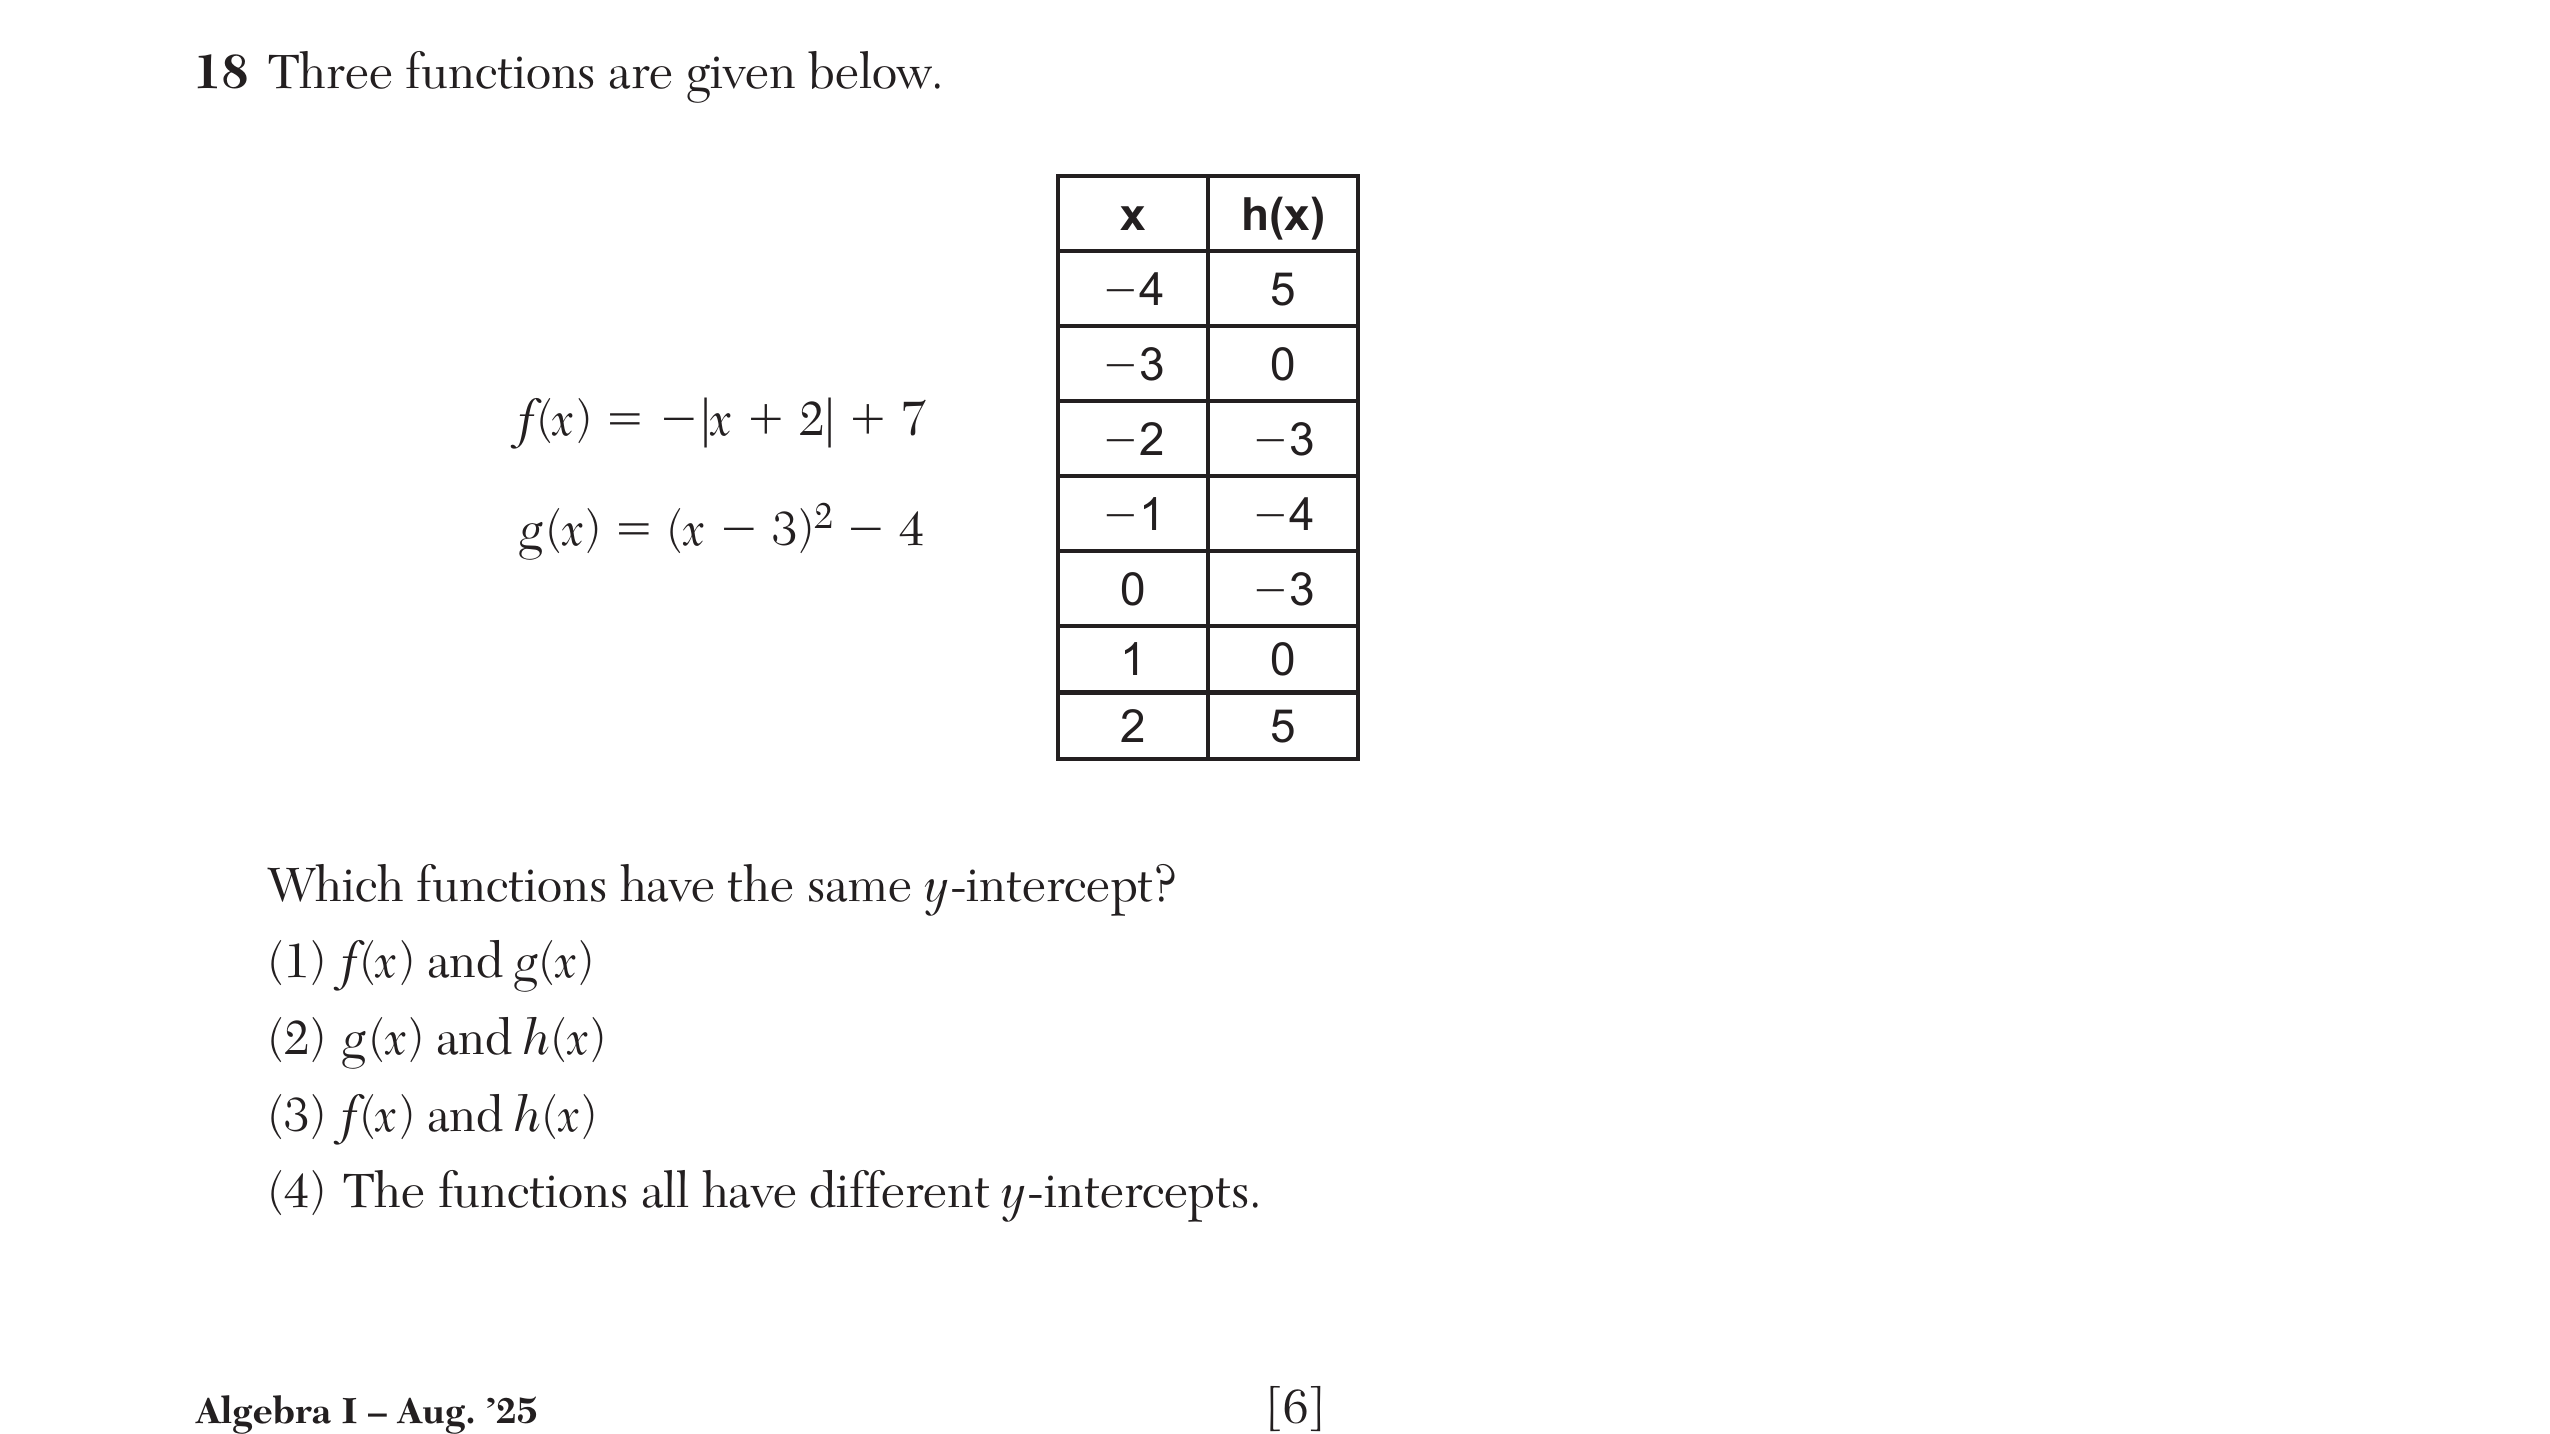
F-IF.92 questions
Compare properties of two functions each represented in a different way (algebraically, graphically, numerically in tables, or by verbal descriptions).
F-BF.1
Write a function that describes a relationship between two quantities.
F-IF.45 questions
For a function that models a relationship between two quantities: i) interpret key features of graphs and tables in terms of the quantities; and ii) sketch graphs showing key features given a verbal description of the relationship.