Connecting Equations to Graphs (Part 1)
Student Summary
Linear equations can be written in different forms. Some forms allow us to better see the relationship between quantities or to predict the graph of the equation.
Suppose a person wishes to travel 7,000 meters a day by running and swimming. The person runs at a speed of 130 meters per minute and swims at a speed of 54 meters per minute.
Let x represents the number of minutes of running and y the number of minutes of swimming. To represent the combination of running and swimming that would allow the person to travel 7,000 meters, we can write:
130x+54y=7,000
We can reason that the more minutes the person runs, the fewer minutes the person has to swim to meet the goal. In other words, as x increases, y decreases. If we graph the equation, the line will slant down from left to right.
If the person only runs and doesn't swim, how many minutes would the person need to run?
Let's substitute 0 for y to find x:
130x+54(0)=7,000130x=7,000x=1307,000x=53.85
On a graph, this combination of times is the point (53.85,0), which is the x-intercept.
If the person only swims and doesn't run, how many minutes would the person need to swim?
Let's substitute 0 for x to find y:
130(0)+54y=7,00054y=7,000y=547,000y=129.63
On a graph, this combination of times is the point (0,129.63), which is the y-intercept.
To determine how many minutes the person would need to swim after running for 15 minutes, 20 minutes, or 30 minutes, substitute each of these values for x in the equation and find y. Or, first solve the equation for y:
130x+54y=7,00054y=7,000−130xy=547,000−130xy=129.63−2.41x
Notice that y=129.63−2.41x, or y=-2.41x+129.63, is written in slope-intercept form.
- The coefficient of x, -2.41, is the slope of the graph. It means that as x increases by 1, y falls by 2.41. For every additional minute of running, the person can swim 2.41 fewer minutes.
- The constant term, 129.63, tells us where the graph intersects the y-axis. It tells us the number minutes the person would need to swim if they do no running.
The first equation we wrote, 130x+54y=7,000, is a linear equation in standard form. In general, it is expressed as Ax+By=C, where x and y are variables, and A,B, and C are numbers.
The two equations, 130x+54y=7,000 and y=-2.41x+129.63, are equivalent, so they have the same solutions and the same graph.
Visual / Anchor Chart

Standards
8.EE.6
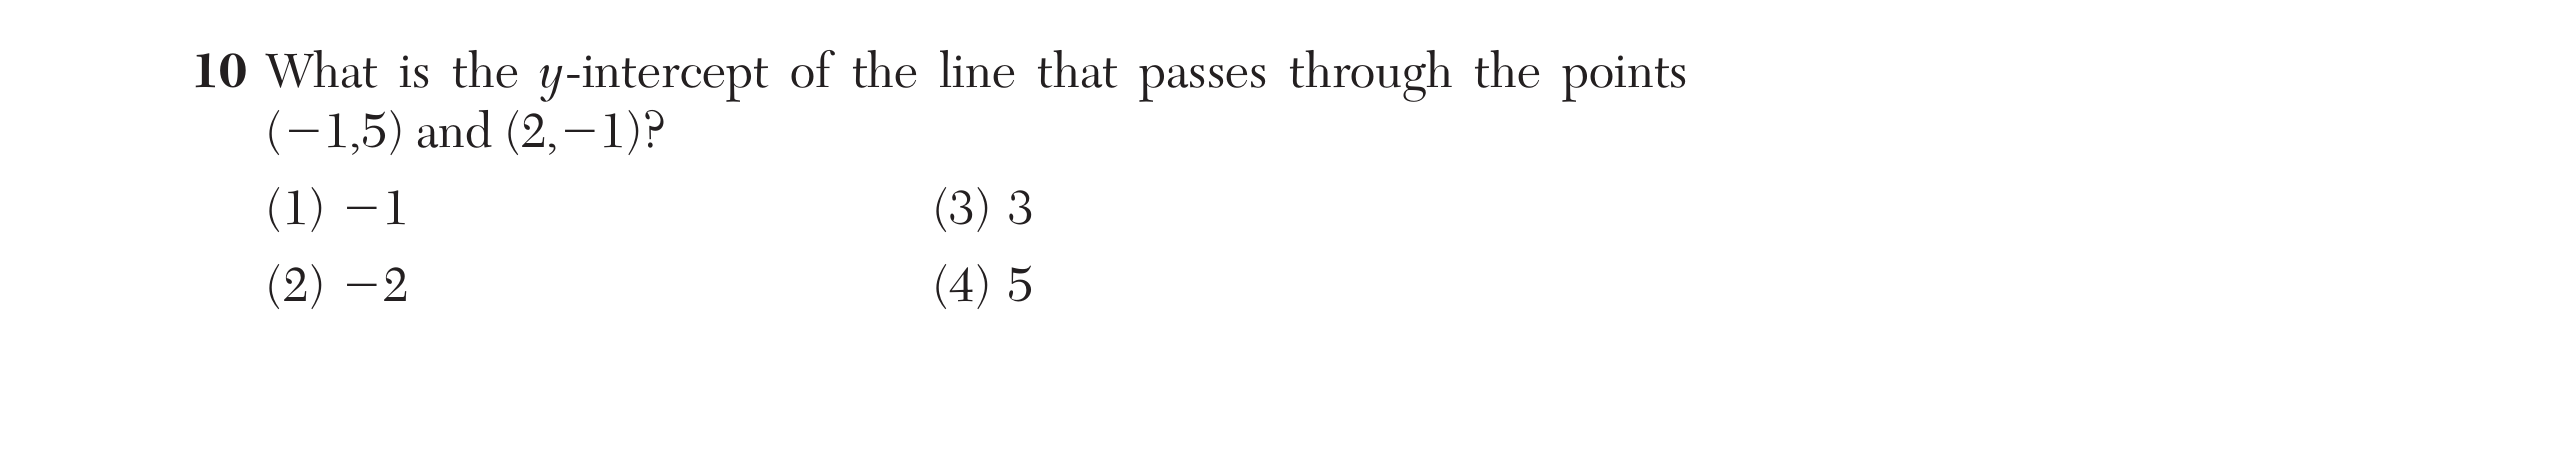
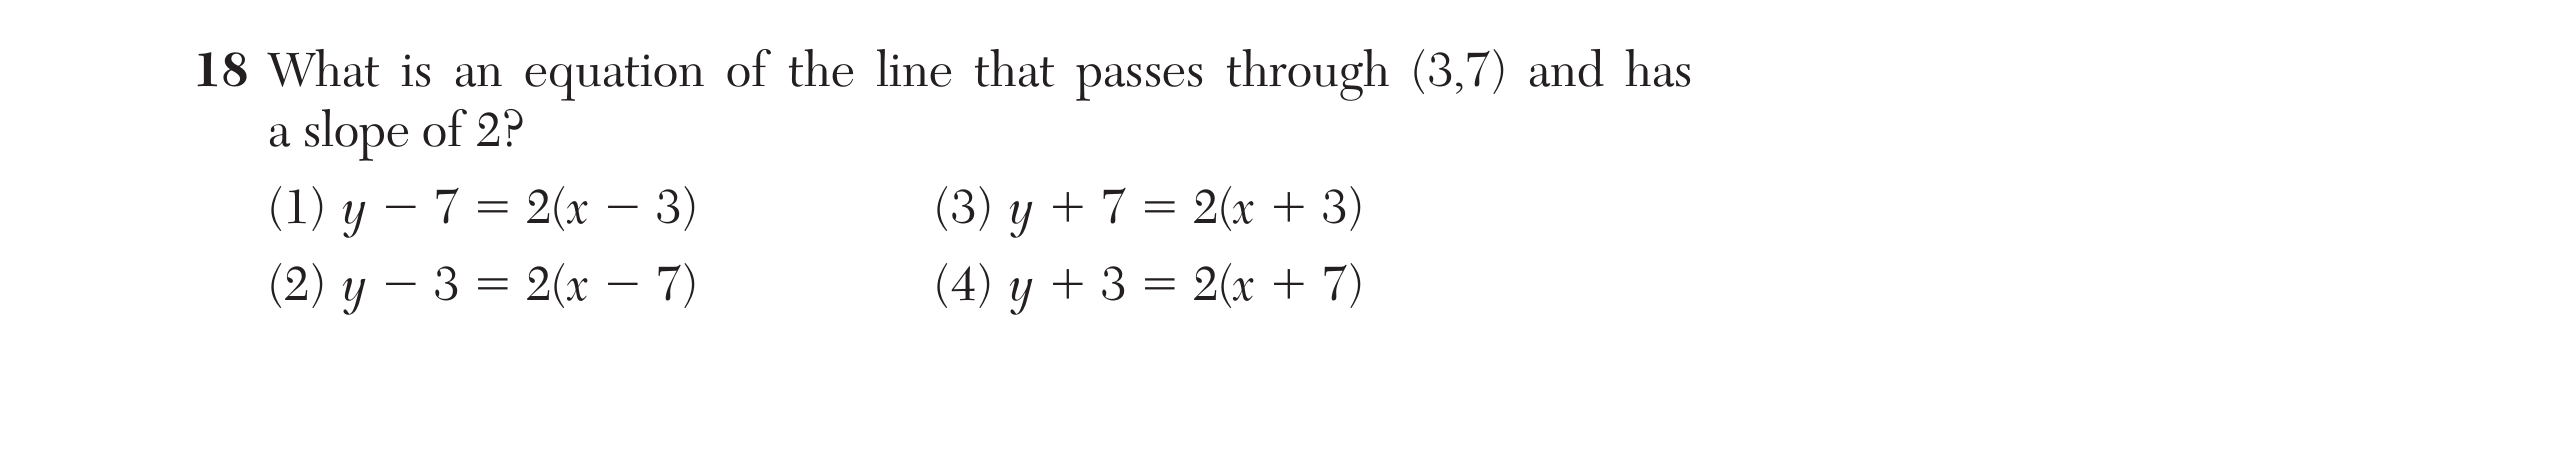
Use similar triangles to explain why the slope m is the same between any two distinct points on a non-vertical line in the coordinate plane; derive the equation y = mx for a line through the origin and the equation y = mx + b for a line intercepting the vertical axis at b.
A-SSE.1.a
Interpret expressions that represent a quantity in terms of its context.
A-CED.36 questions
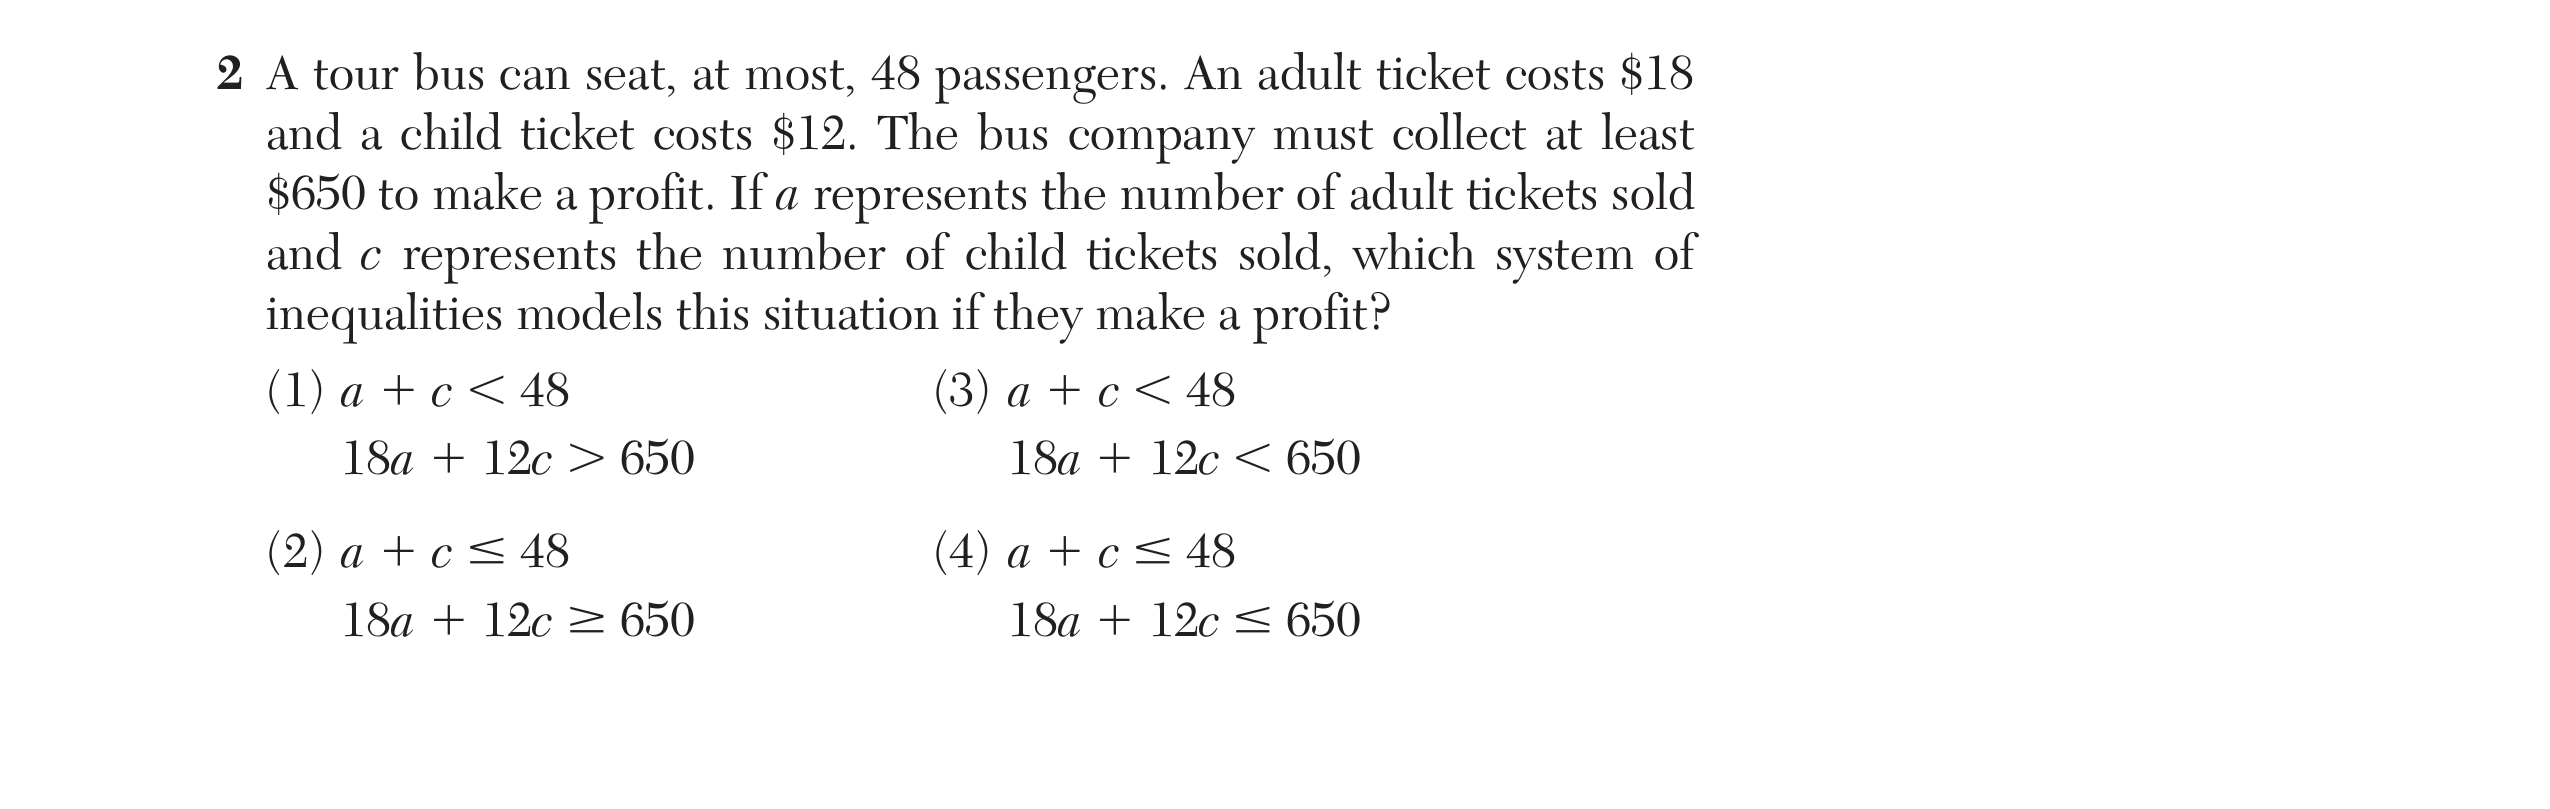
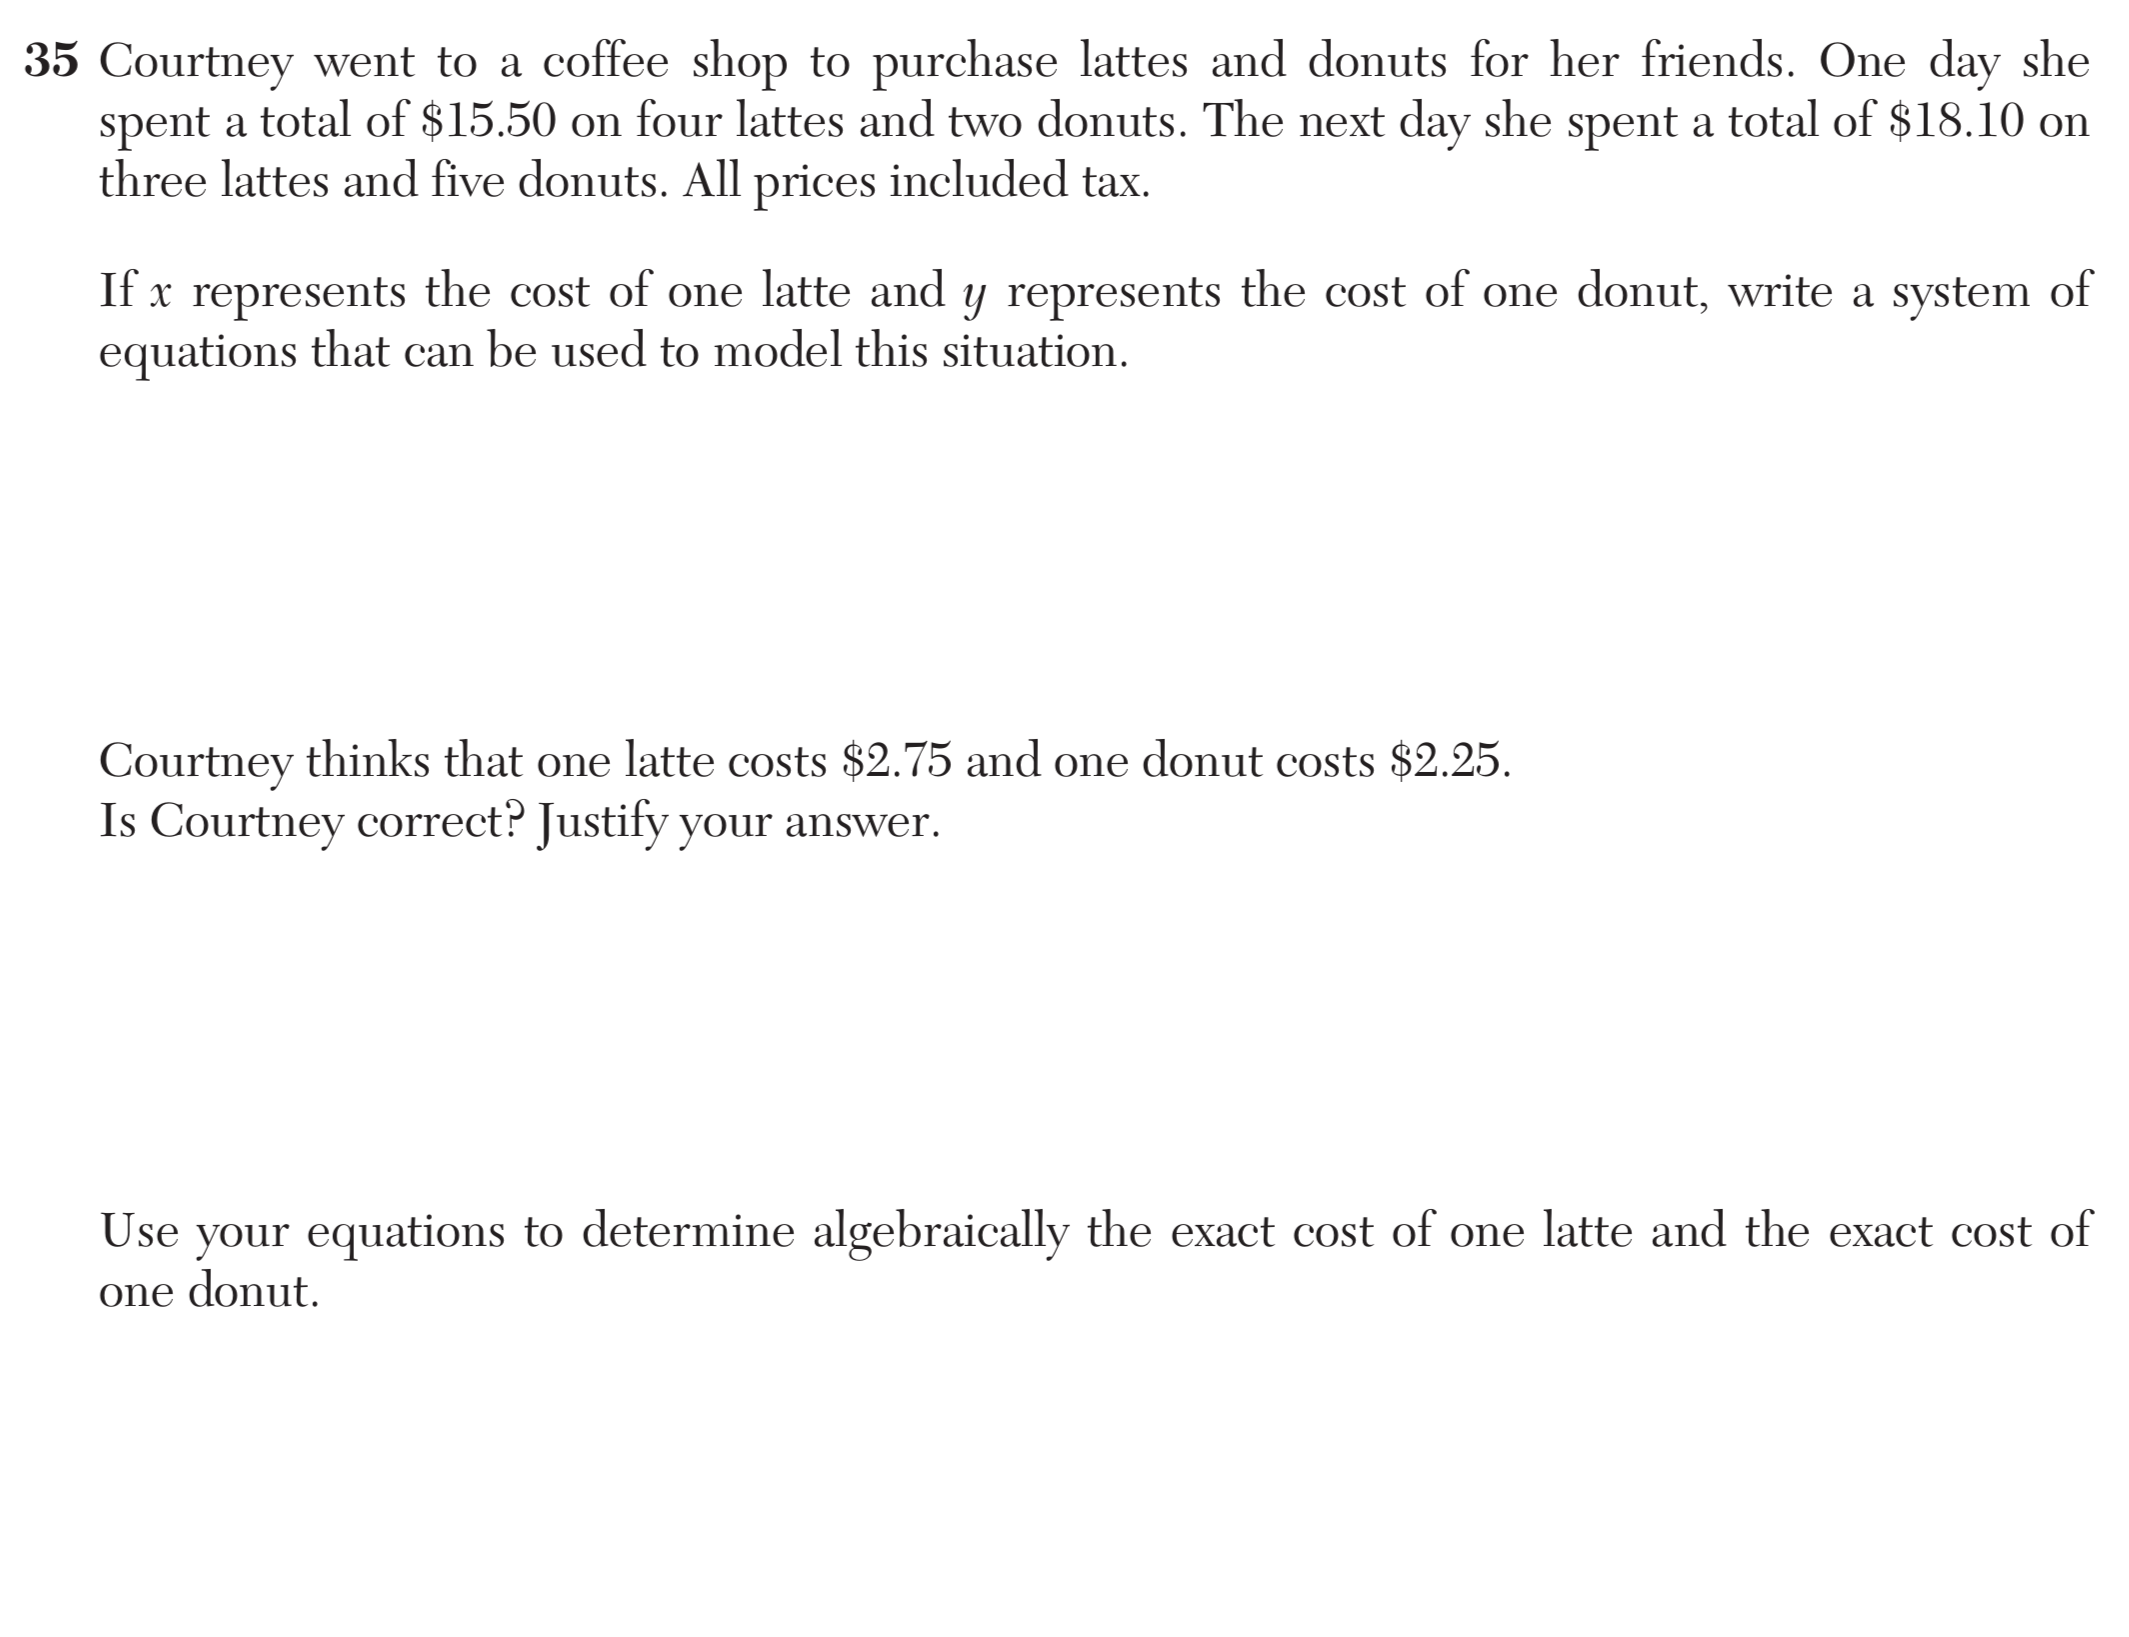
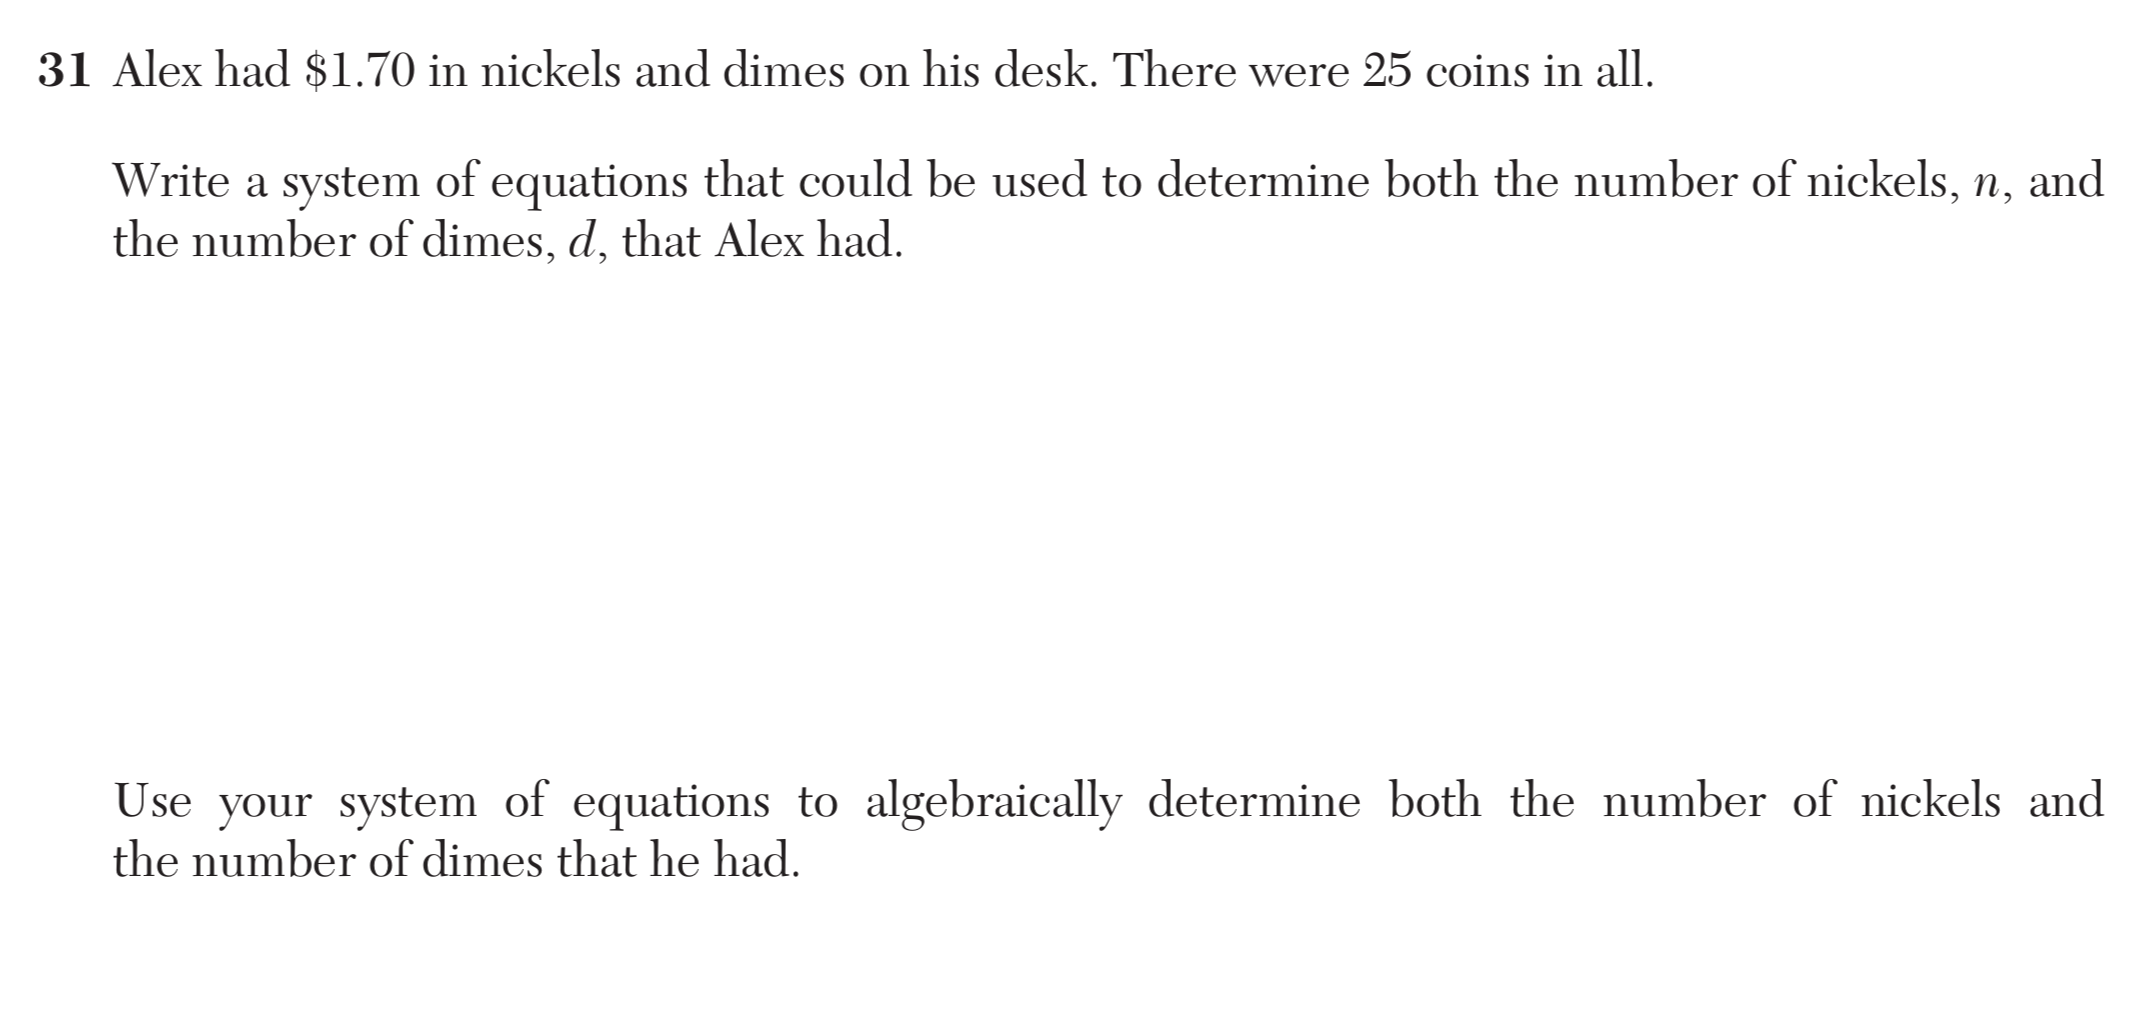
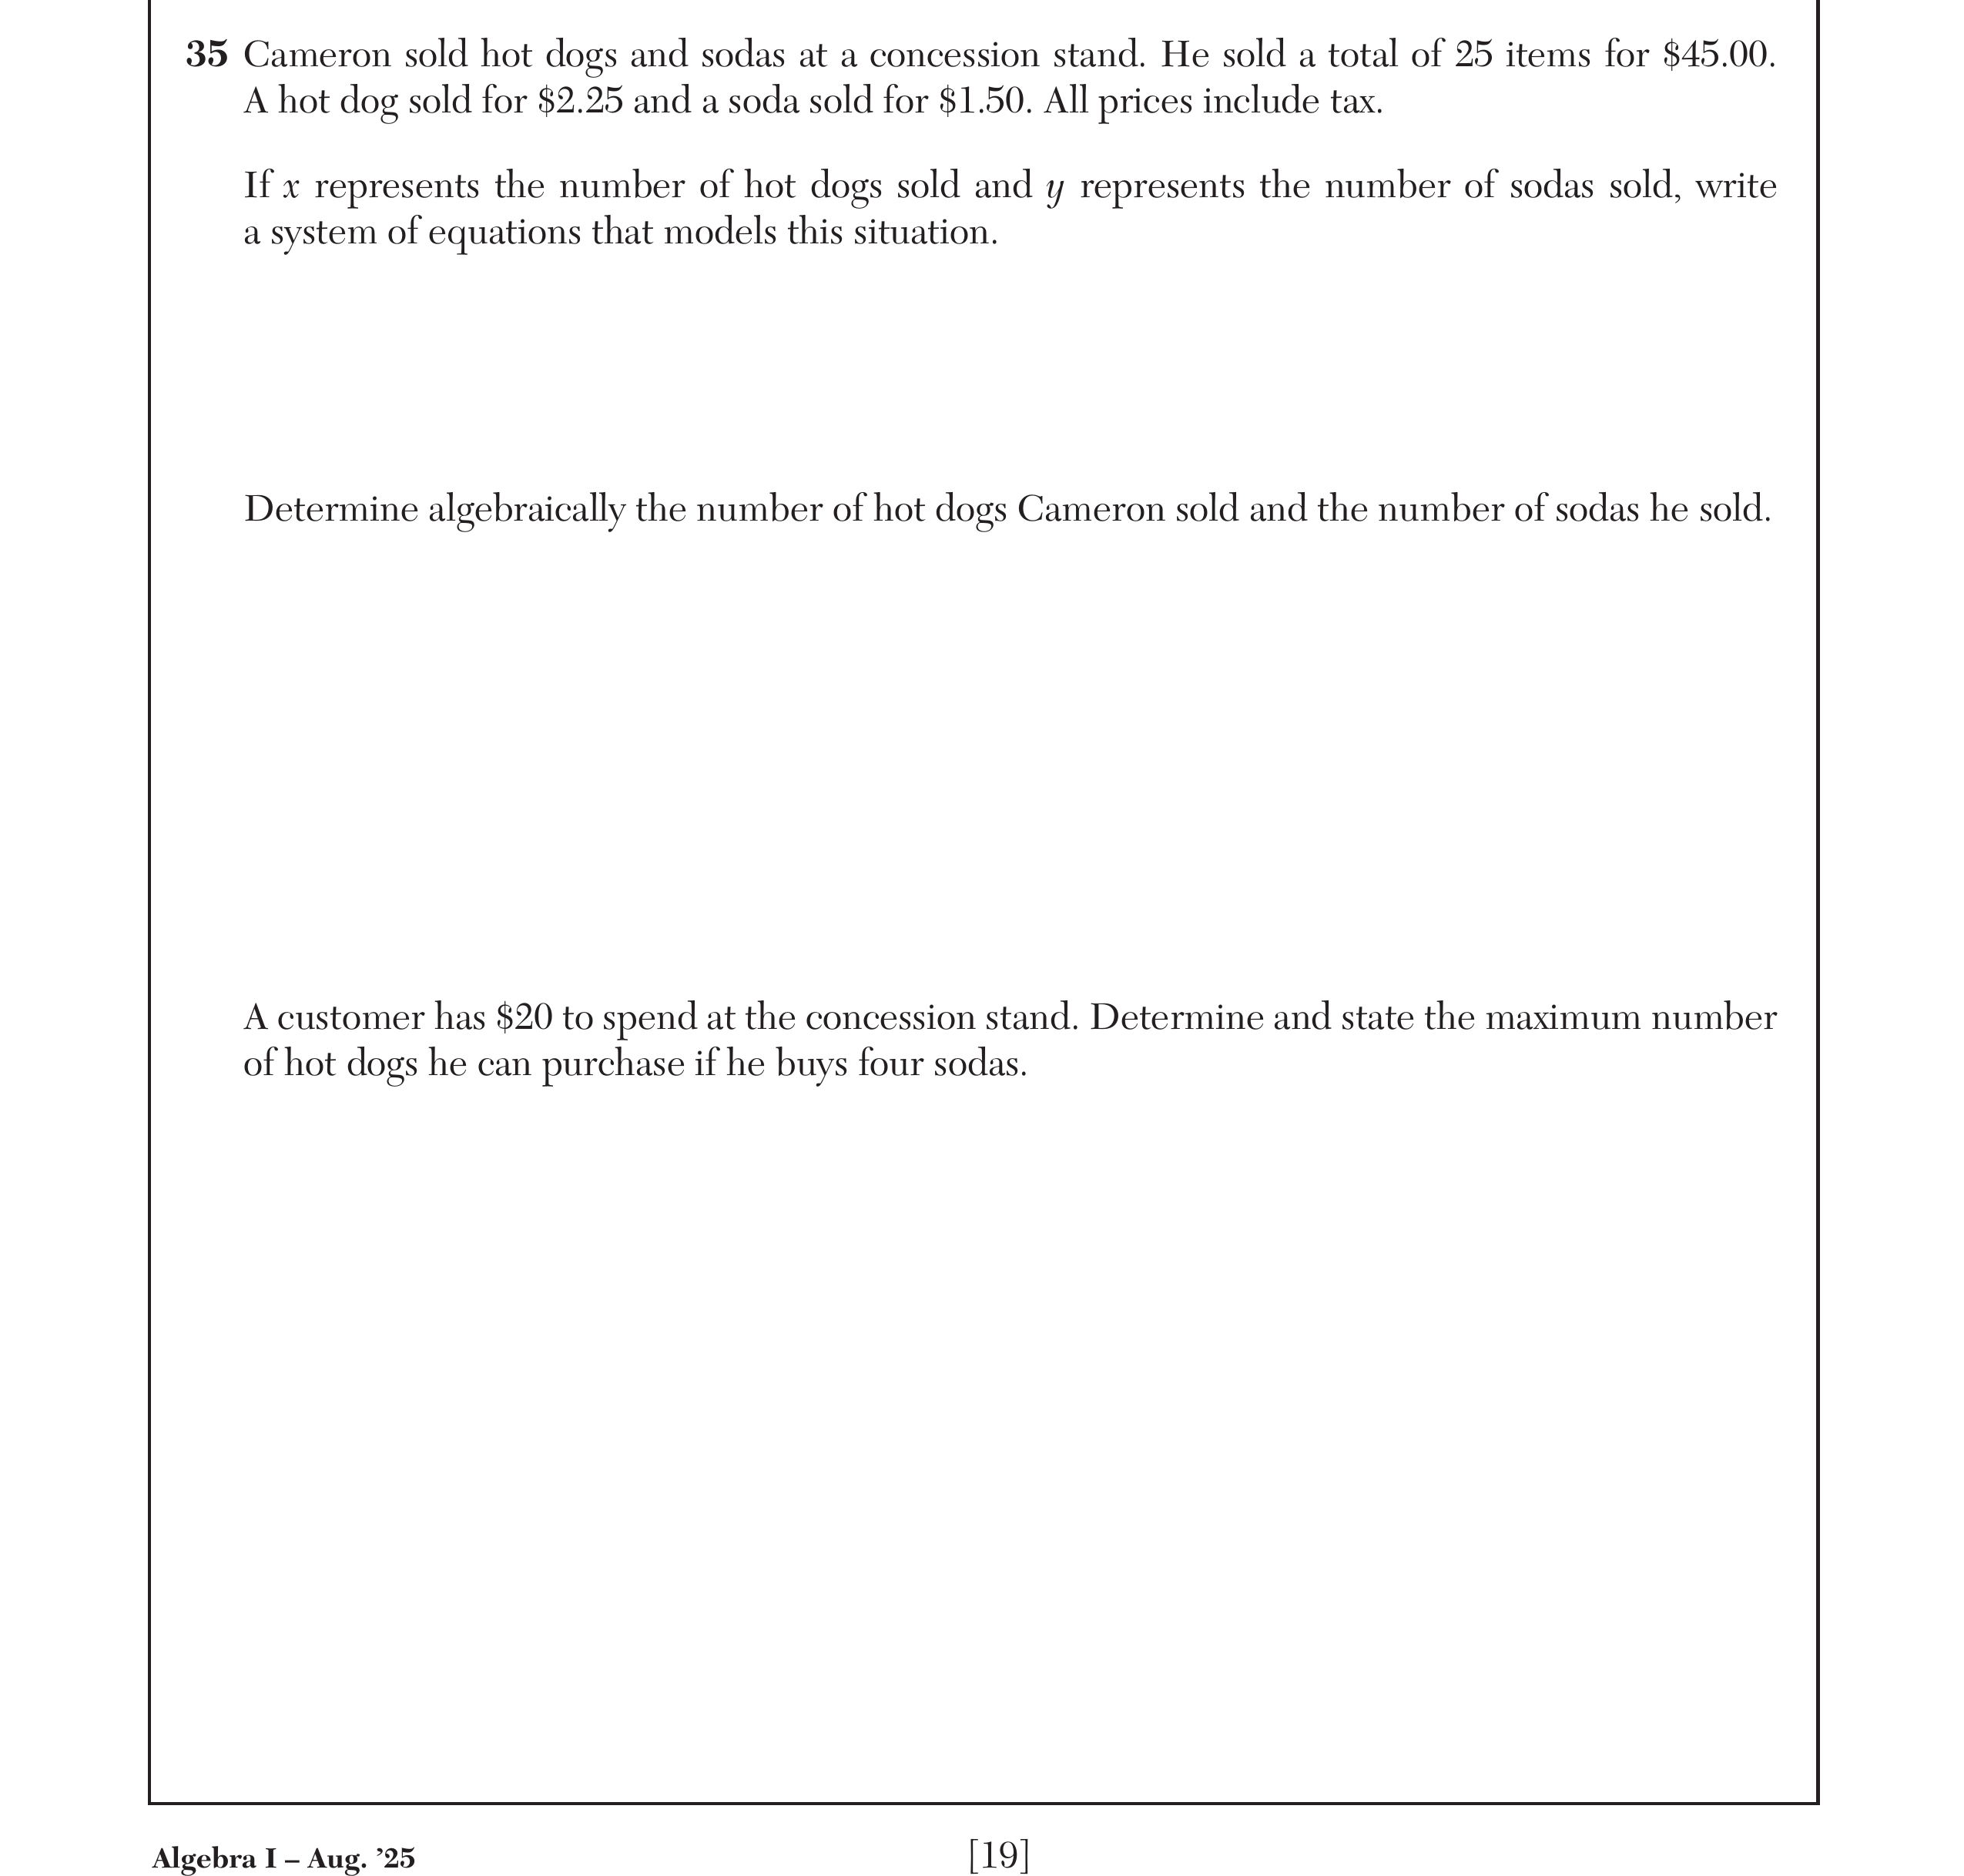
Represent constraints by equations or inequalities, and by systems of equations and/or inequalities, and interpret solutions as viable or non-viable options in a modeling context.
A-CED.44 questions
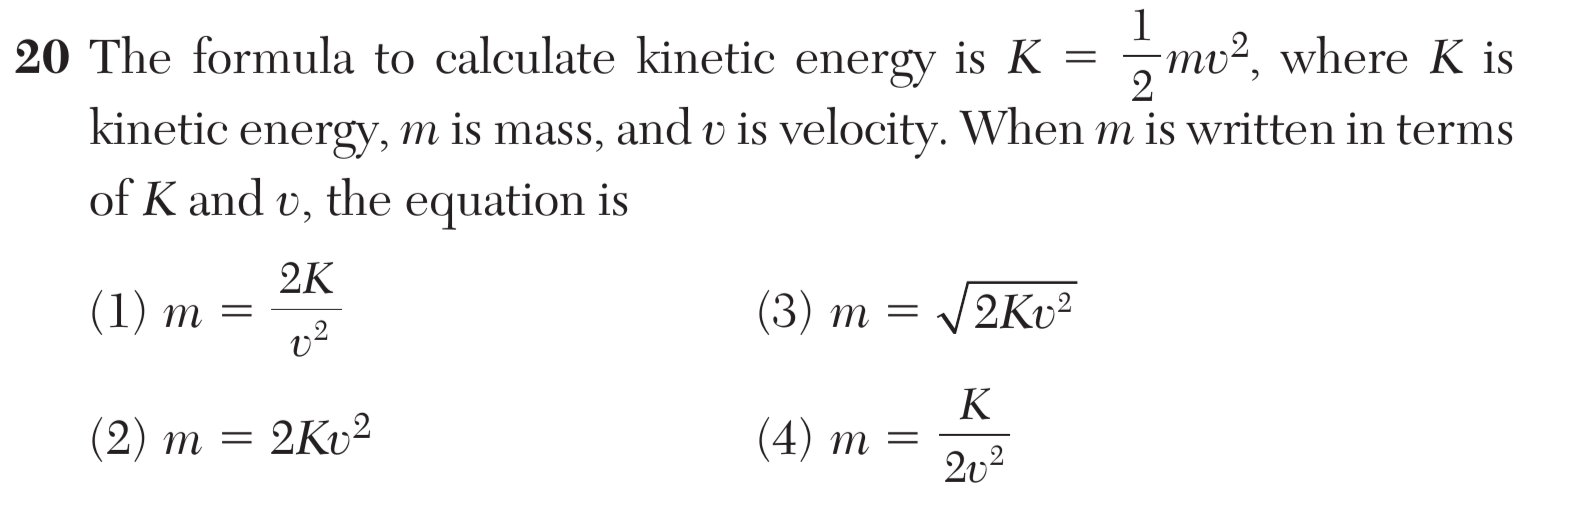
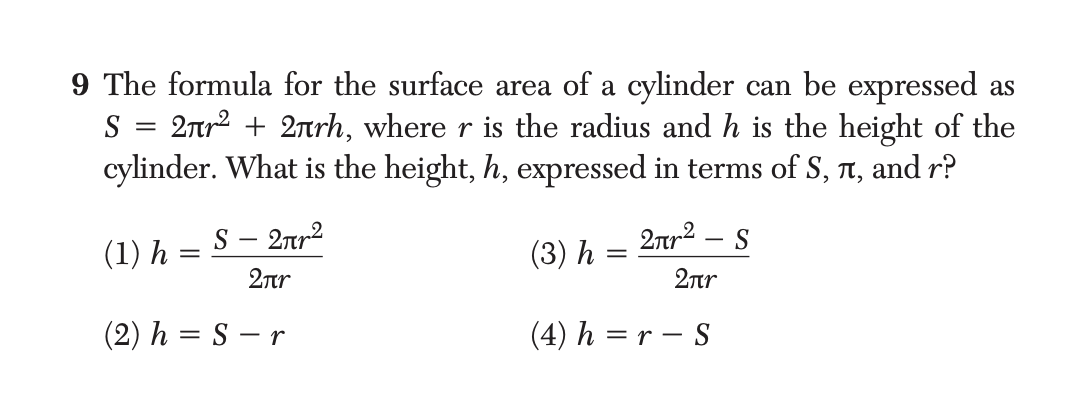
Rewrite formulas to highlight a quantity of interest, using the same reasoning as in solving equations.
A-REI.108 questions
Understand that the graph of an equation in two variables is the set of all its solutions plotted in the coordinate plane.
F-IF.7.a
Graph functions and show key features of the graph by hand and by using technology where appropriate.