Graphing Linear Inequalities in Two Variables (Part 1)
Student Summary
The equation x+y=7 is an equation in two variables. Its solution is any pair of x and y whose sum is 7. The pairs x=0,y=7 and x=5,y=2 are two examples.
We can represent all the solutions to x+y=7 by graphing the equation on a coordinate plane.
The graph is a line. All the points on the line are solutions to x+y=7.
The inequality x+y≤7 is an inequality in two variables. Its solution is any pair of x and y whose sum is 7 or less than 7.
This means it includes all the pairs that are solutions to the equation x+y=7, but also many other pairs of x and y that add up to a value less than 7. The pairs x=4,y=-7 and x=-6,y=0 are two examples.
On a coordinate plane, the solution to x+y≤7 includes the line that represents x+y=7. If we plot a few other (x,y) pairs that make the inequality true, such as (4,-7) and (-6,0), we see that these points fall on one side of the line. (In contrast, (x,y) pairs that make the inequality false fall on the other side of the line.)
We can shade that region on one side of the line to indicate that all points in it are solutions.
What about the inequality x+y<7?
The solution is any pair of x and y whose sum is less than 7. This means pairs like x=0,y=7 and x=5,y=2 are not solutions.
On a coordinate plane, the solution does not include points on the line that represent x+y=7 (because those points are x and y pairs whose sum is 7).
To exclude points on that boundary line, we can use a dashed line.
All points below that line are (x,y) pairs that make x+y<7 true. The region on that side of the line can be shaded to show that it contains the solutions.
Visual / Anchor Chart

Standards
A-REI.124 questions
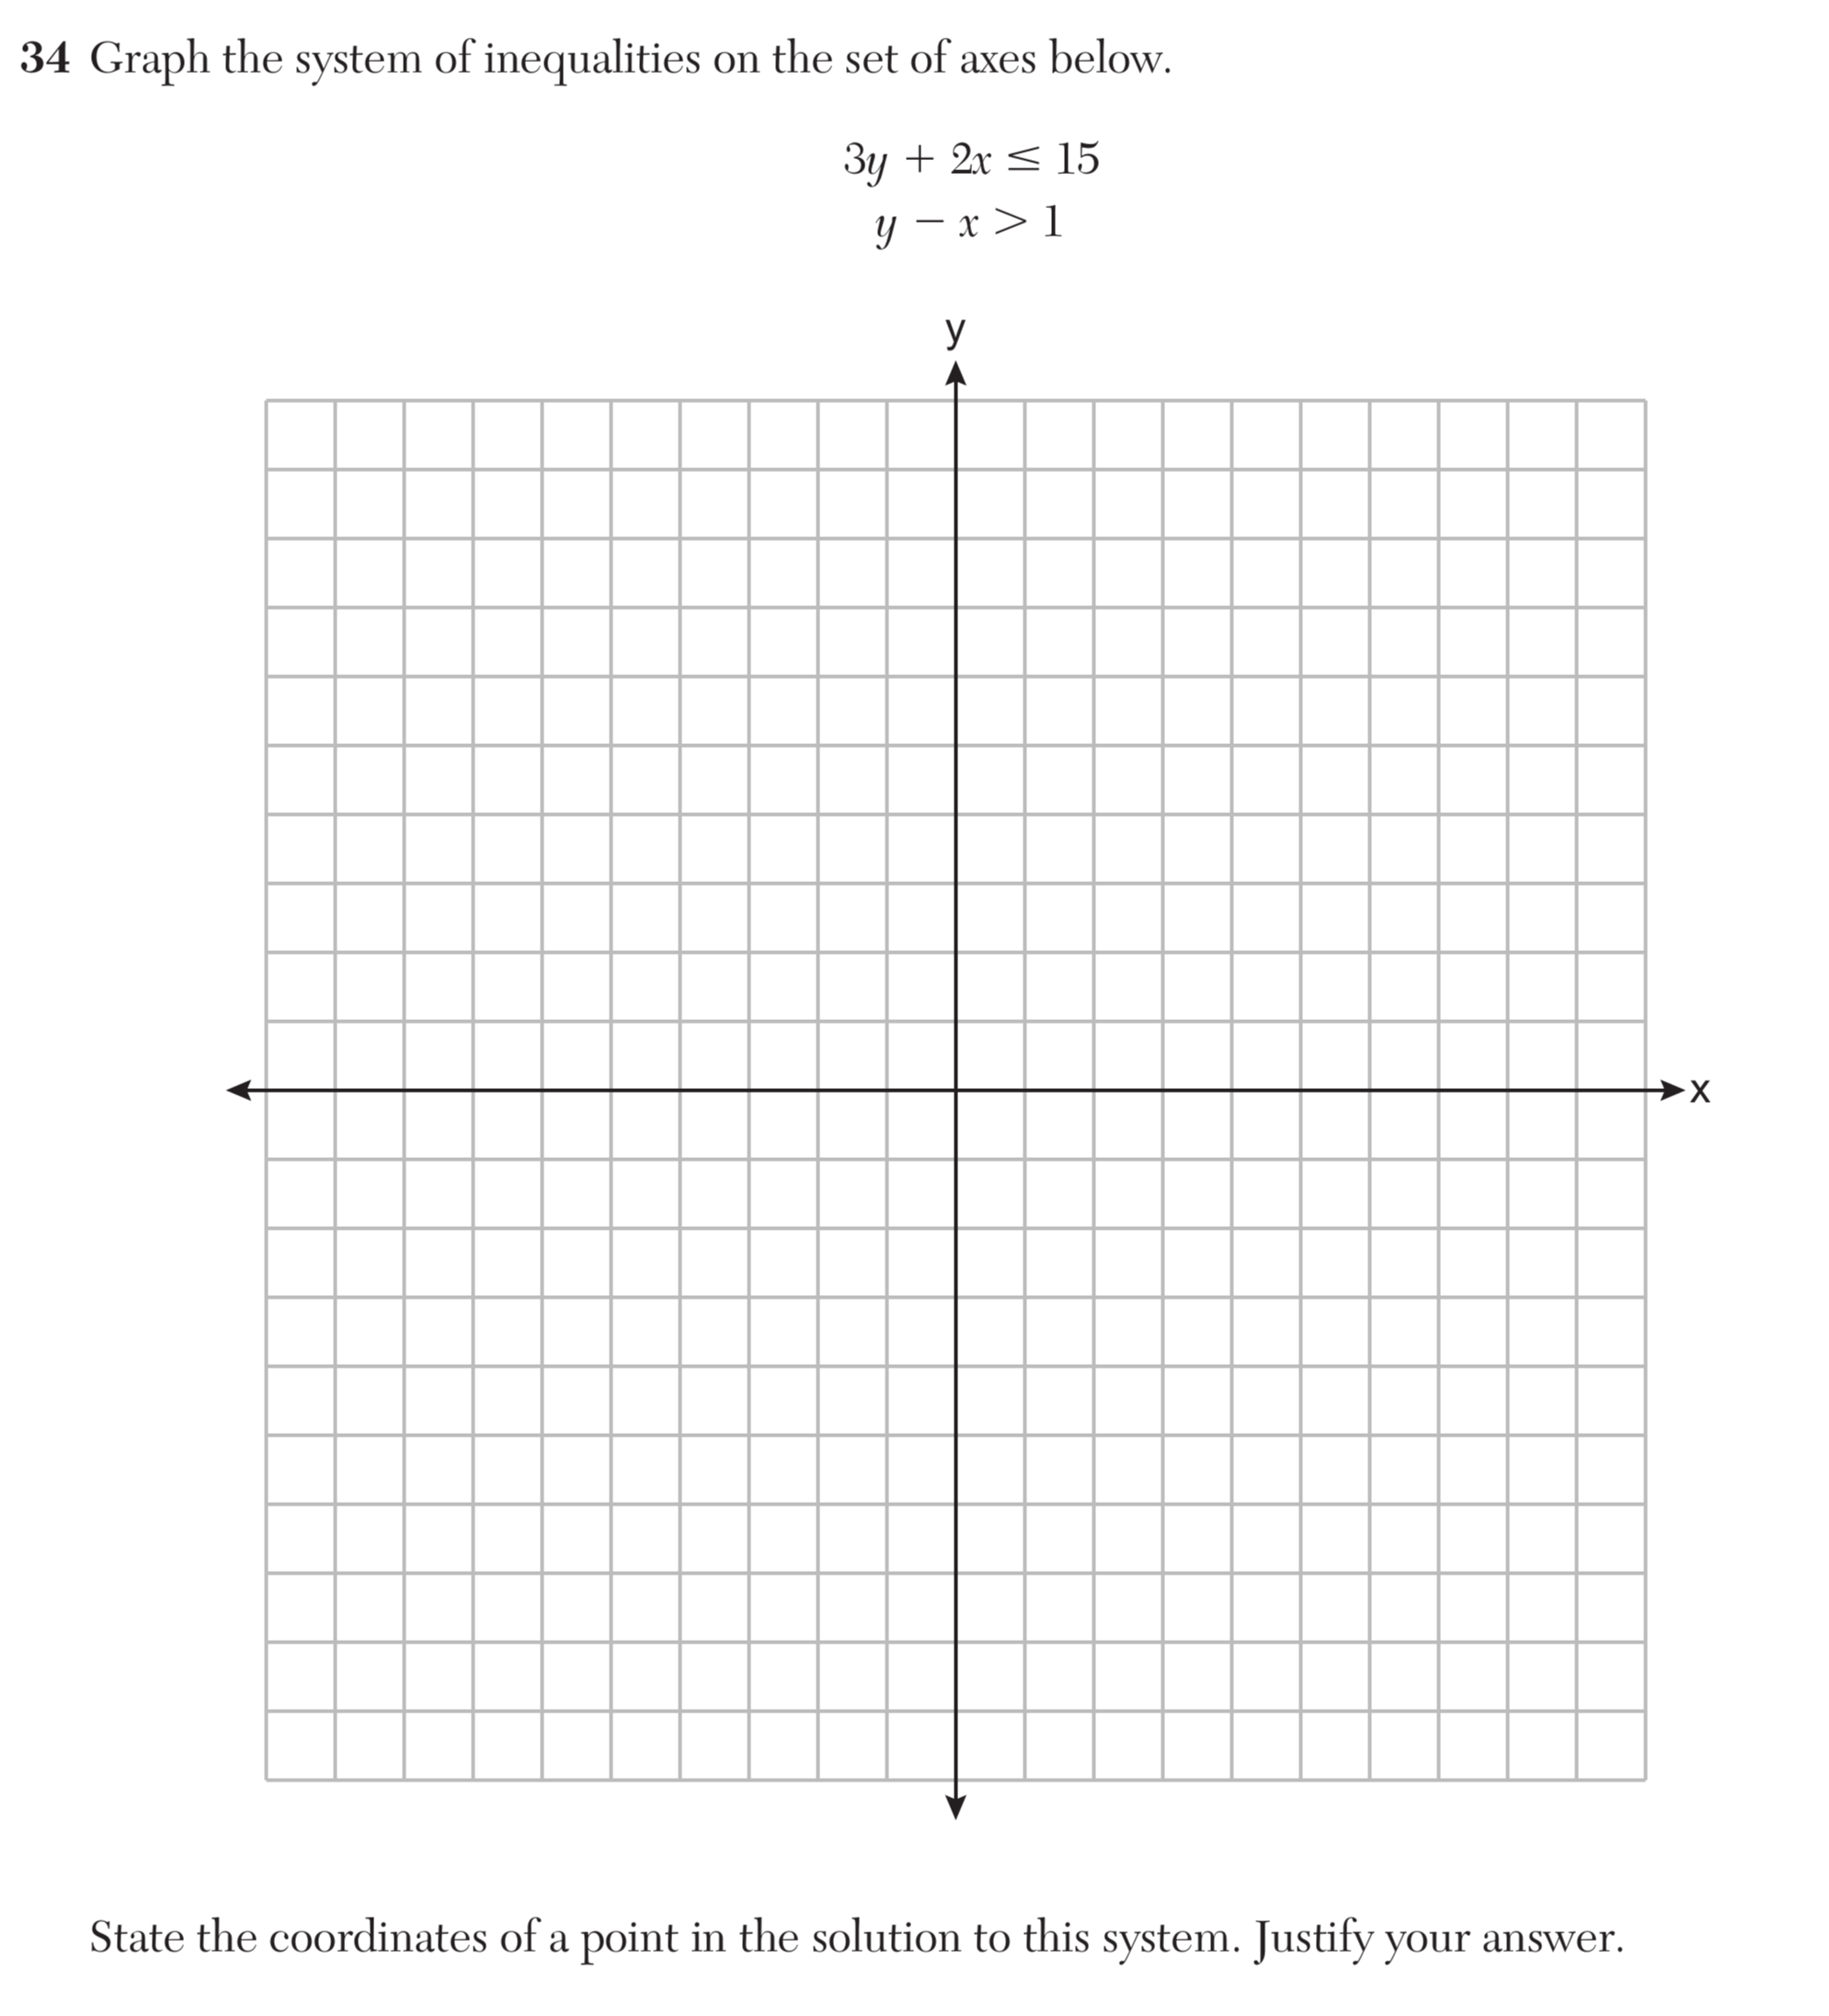
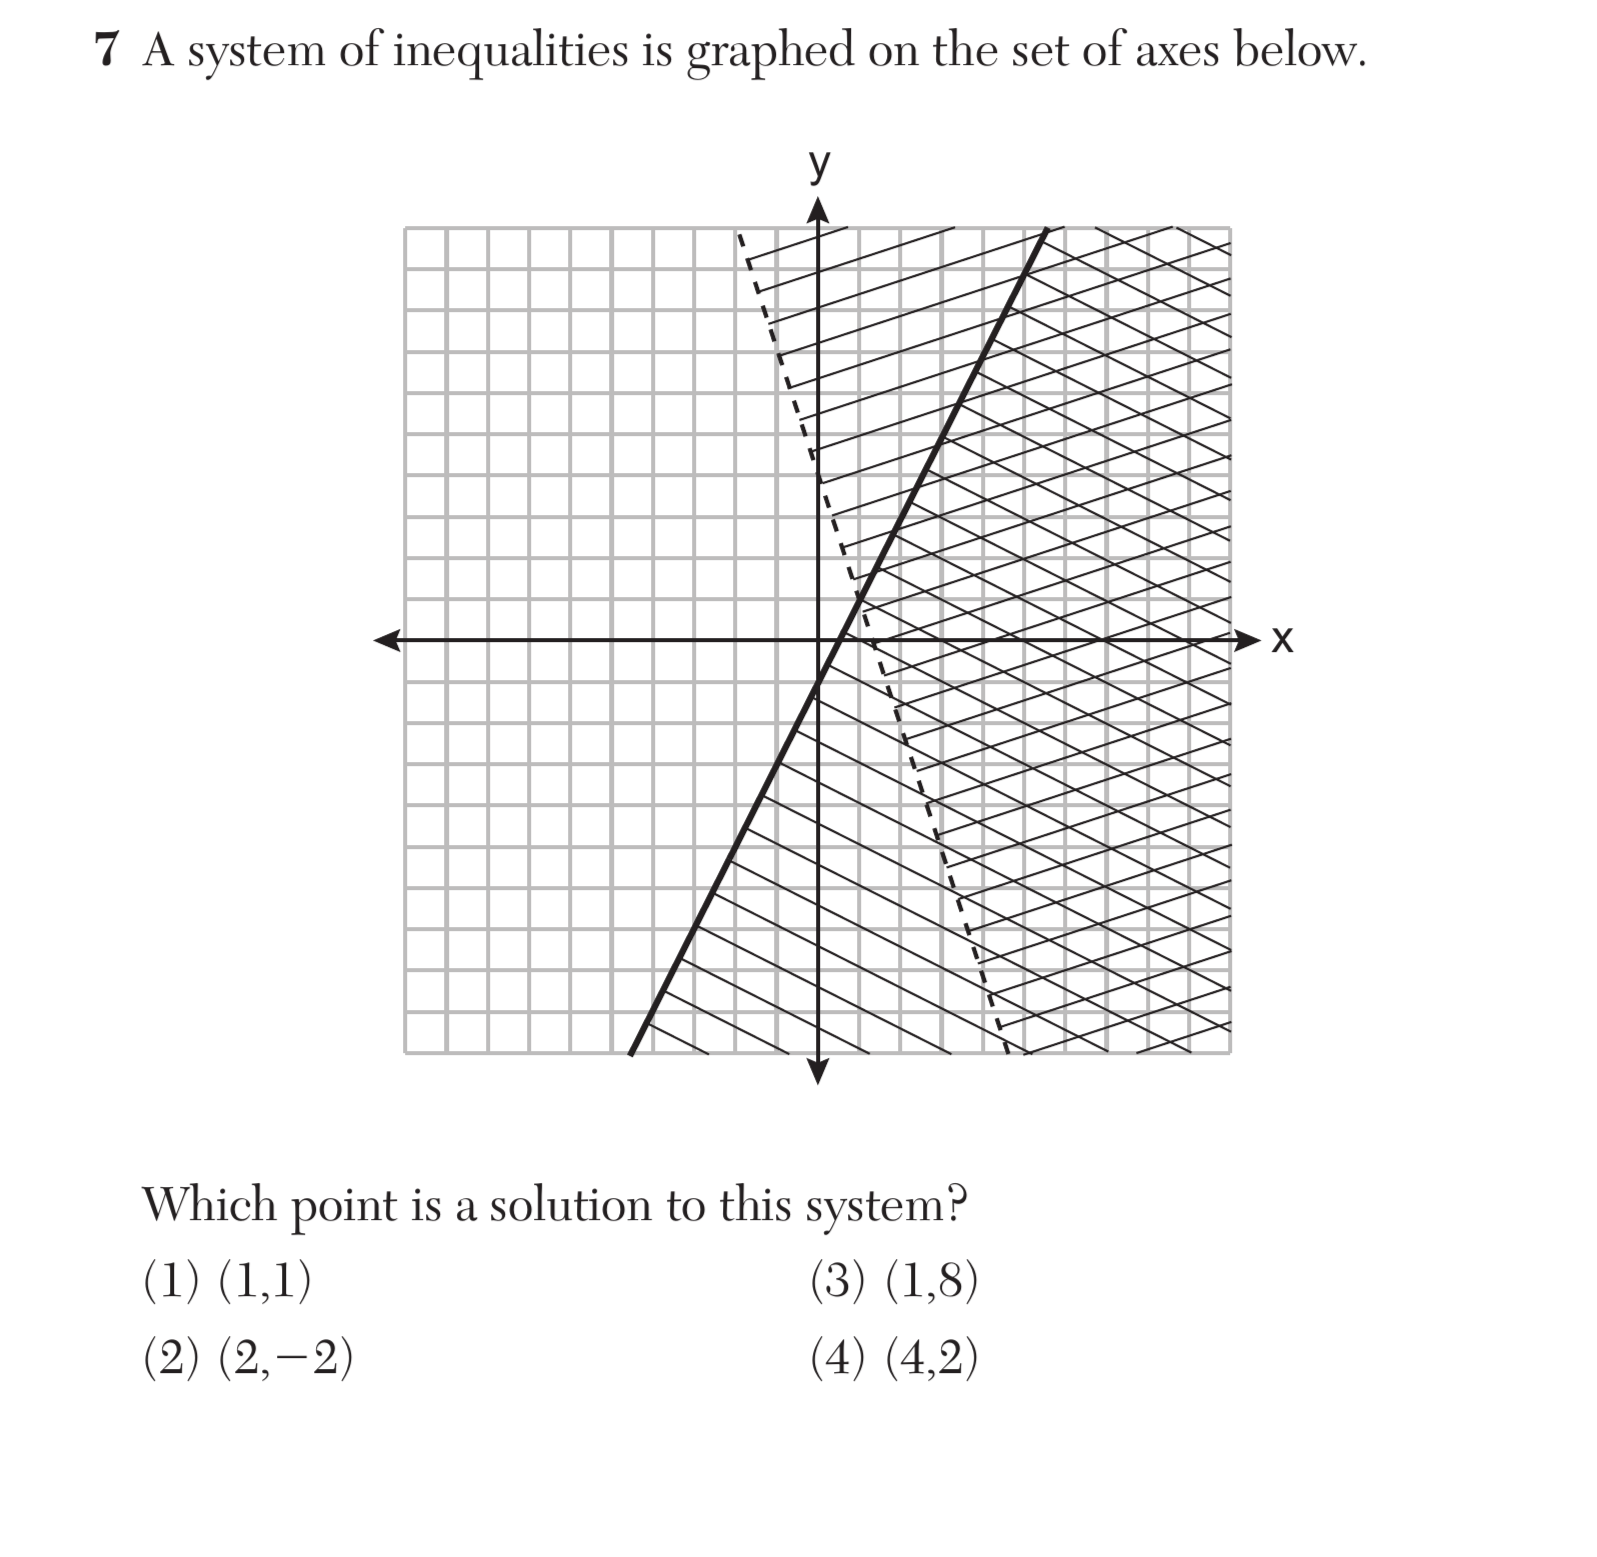
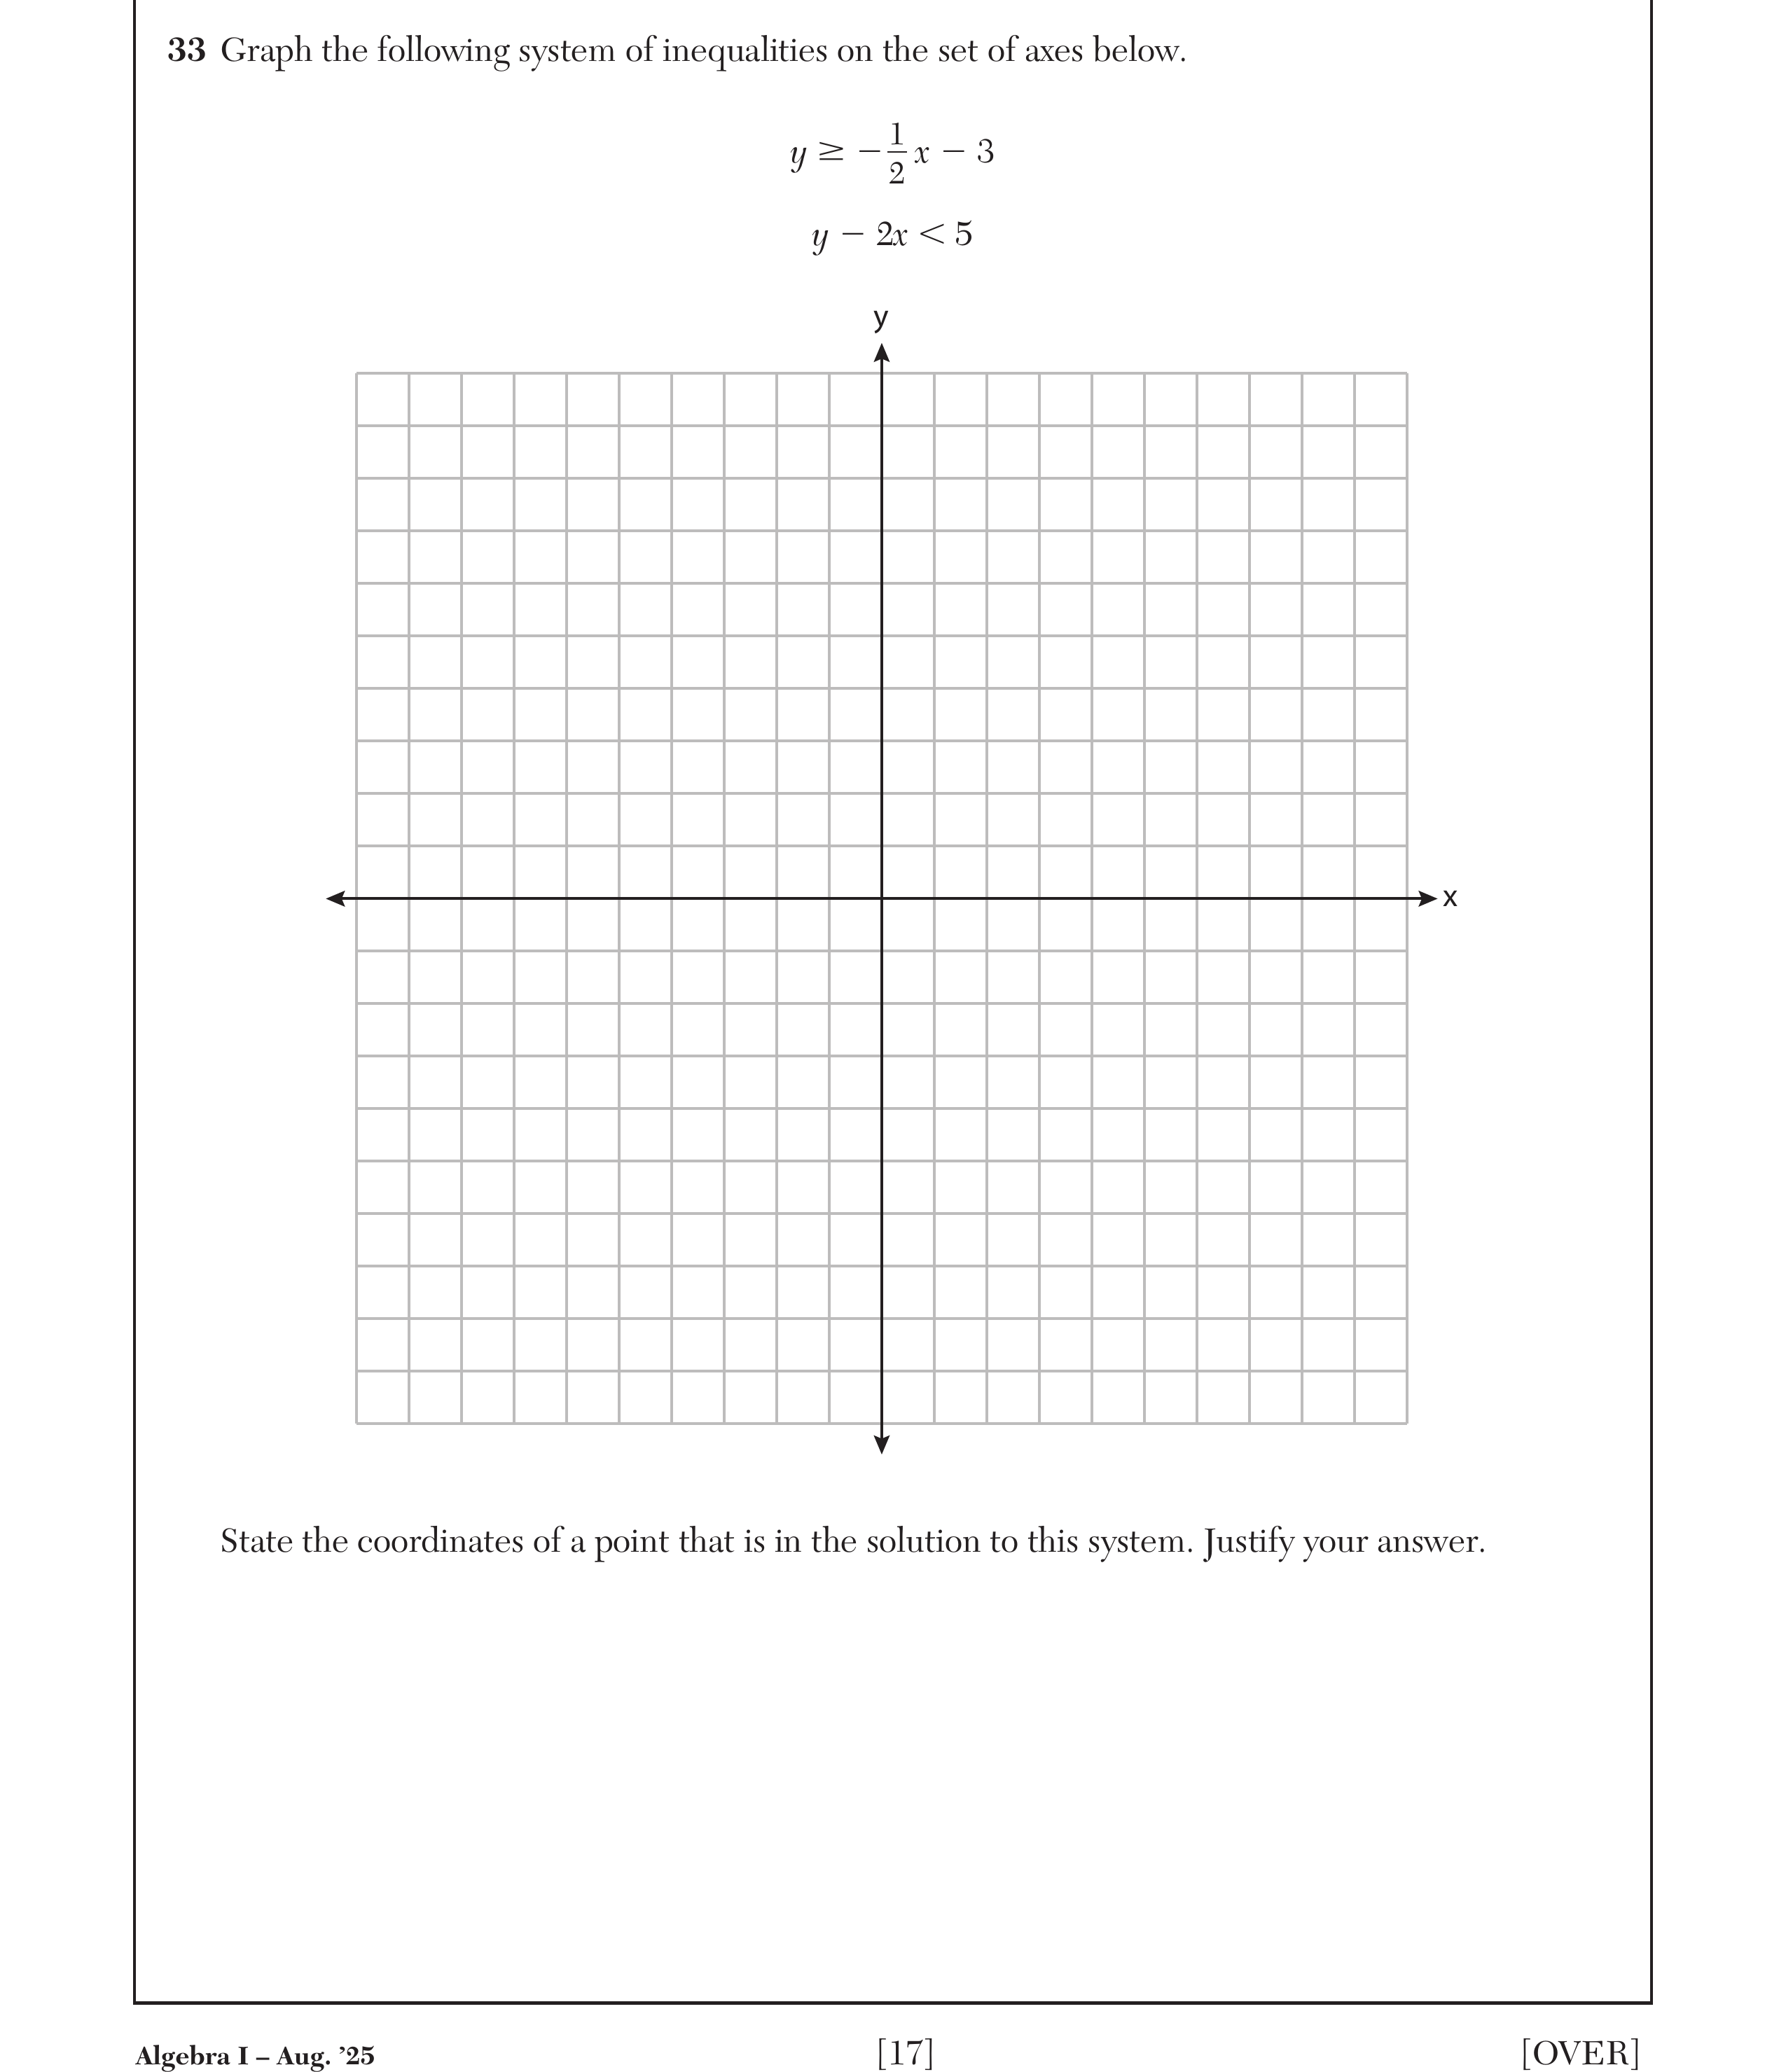
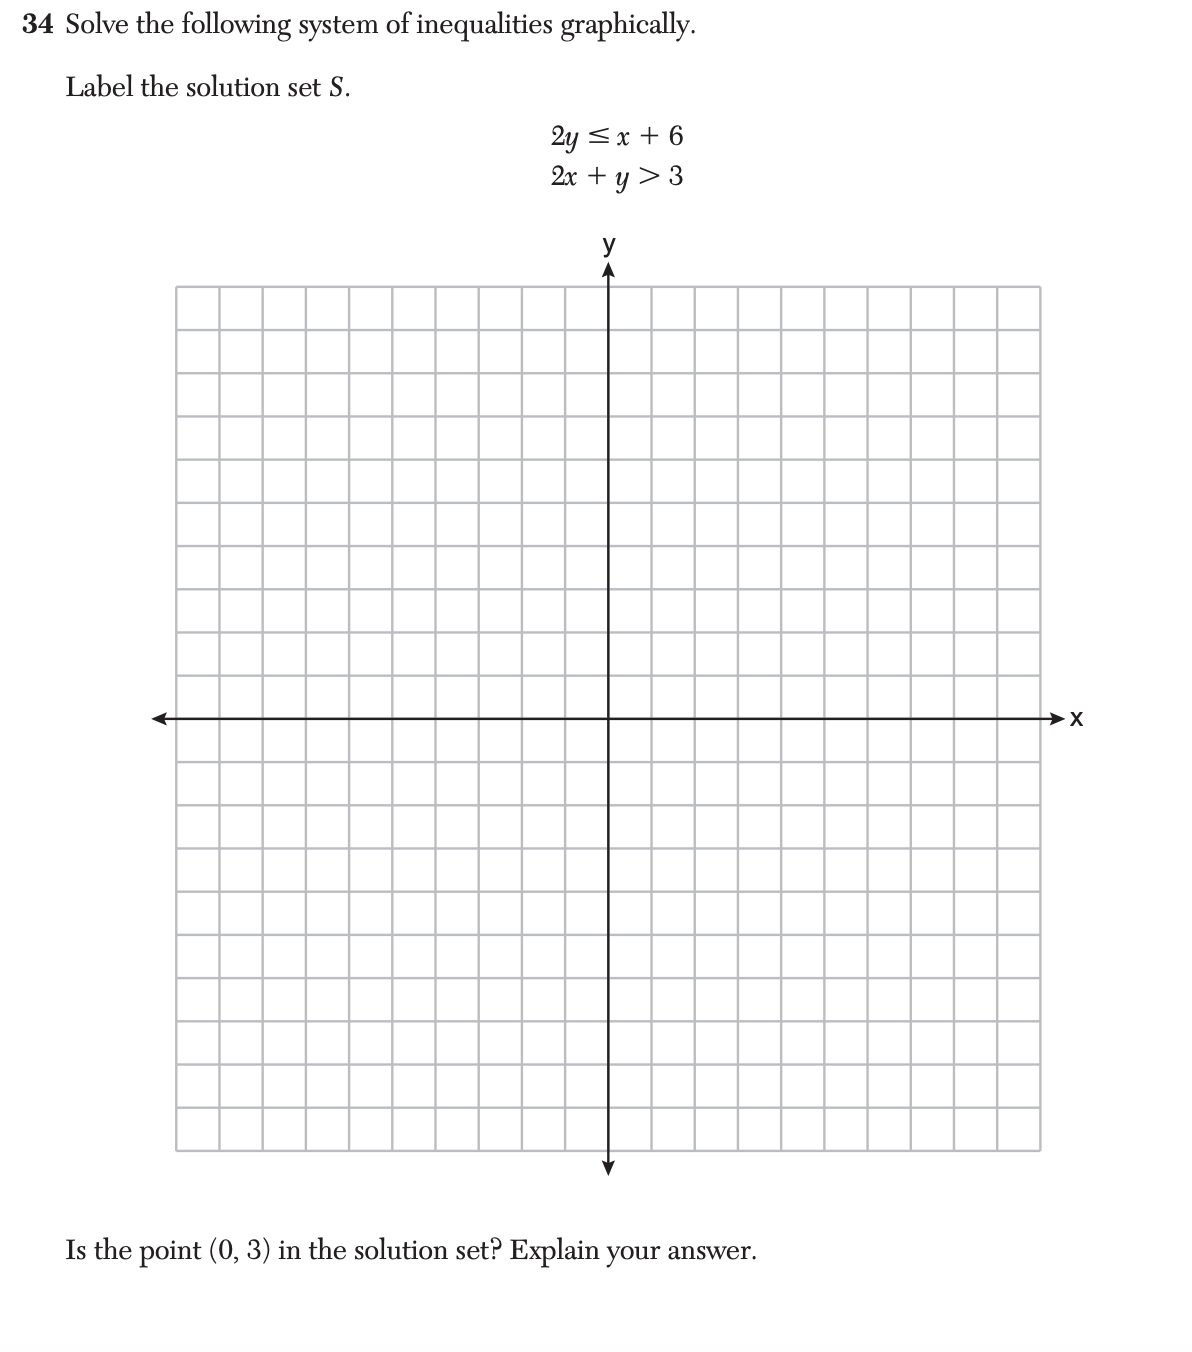
Graph the solutions to a linear inequality in two variables as a half-plane (excluding the boundary in the case of a strict inequality), and graph the solution set to a system of linear inequalities in two variables as the intersection of the corresponding half-planes.
A-REI.124 questions
Graph the solutions to a linear inequality in two variables as a half-plane (excluding the boundary in the case of a strict inequality), and graph the solution set to a system of linear inequalities in two variables as the intersection of the corresponding half-planes.