Modeling Exponential Behavior
Student Summary
Sometimes data suggest an exponential relationship. For example, this table shows the bounce heights of a certain ball. We can see that the height decreases with each bounce.
To find out what fraction of the height remains after each bounce, we can divide two consecutive values: 9561 is about 0.642, 6139 is about 0.639, and 3926 is about 0.667.
All of these quotients are close to 32. This suggests that we could model the relationship with an exponential function, and that the height is decreasing with a factor of about 32 for each successive bounce.
| bounce number | bounce height in centimeters |
|---|---|
| 1 | 95 |
| 2 | 61 |
| 3 | 39 |
| 4 | 26 |
The height, h, of the ball, in cm, after n bounces can be modeled by the equation:
h=142⋅(32)n
Here is a graph of the equation.
This graph shows both the points from the data and the points generated by the equation, which can give us new insights. For example, the height from which the ball was dropped is not given but can be determined. If 32 of the initial height is about 95 centimeters, then that initial height is about 142.5 centimeters, because 95÷32=142.5. For a second example, we can see that it will take 7 bounces before the rebound height is less than 10 centimeters.
Visual / Anchor Chart

Standards
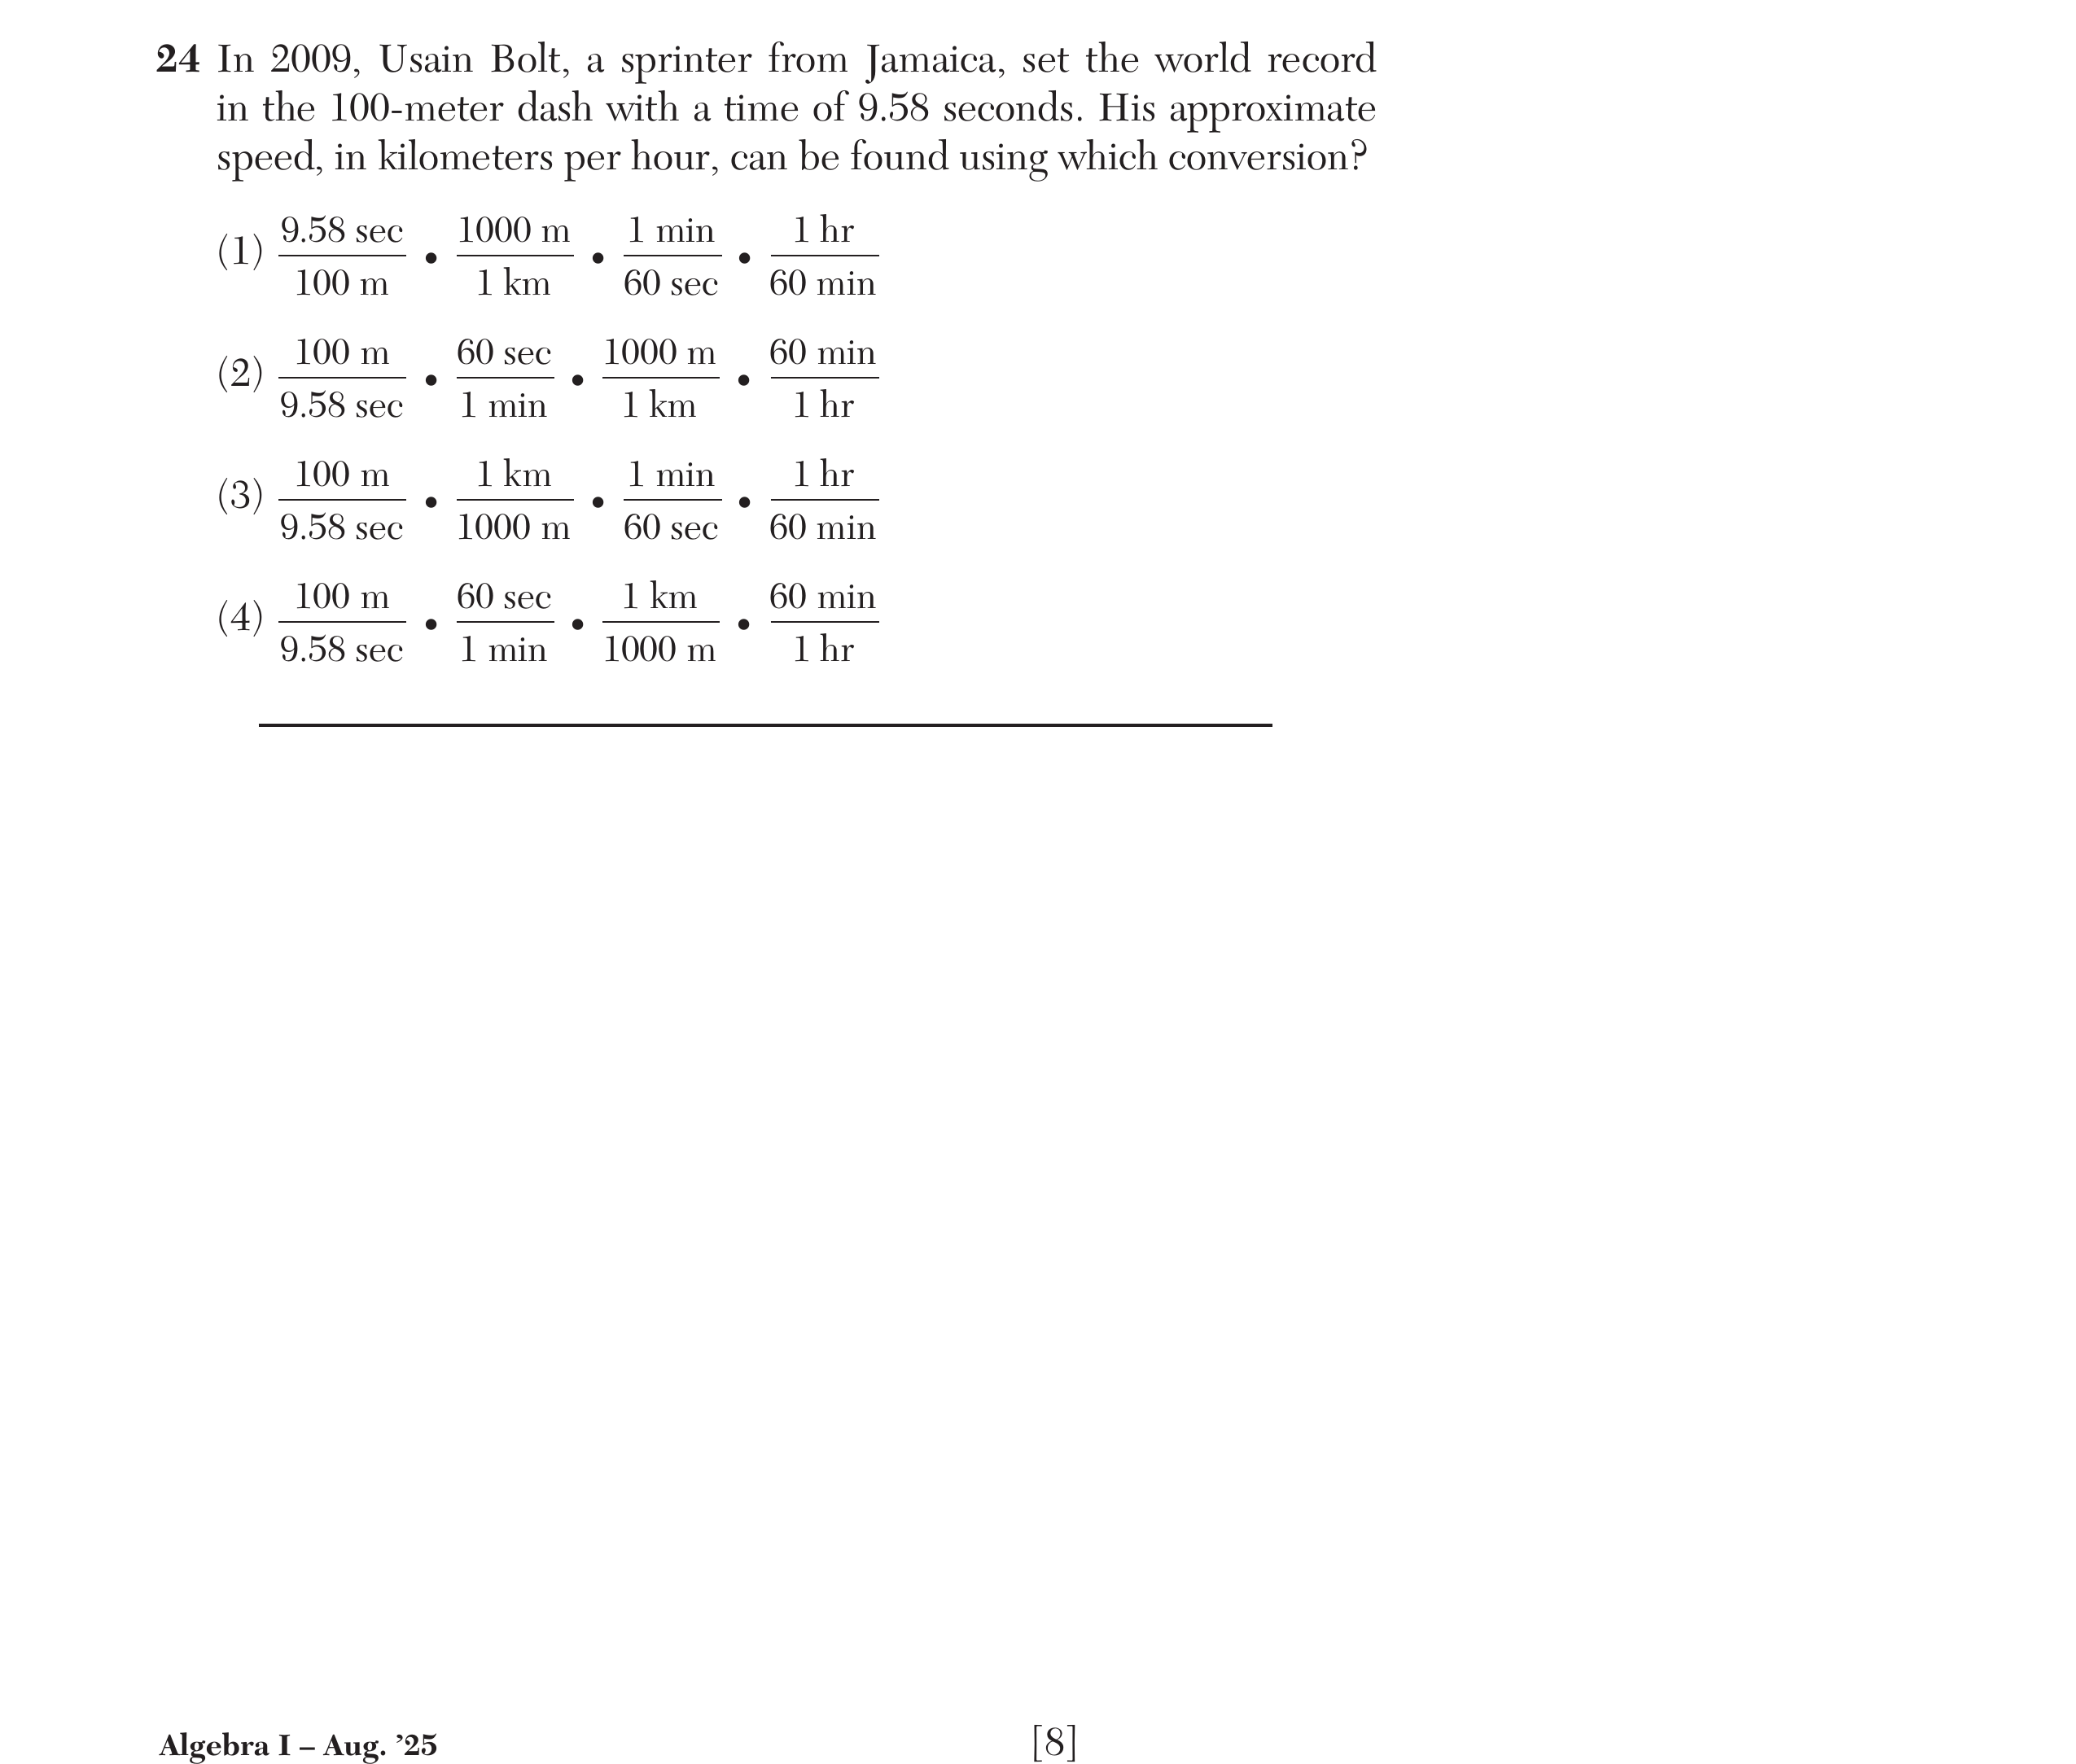
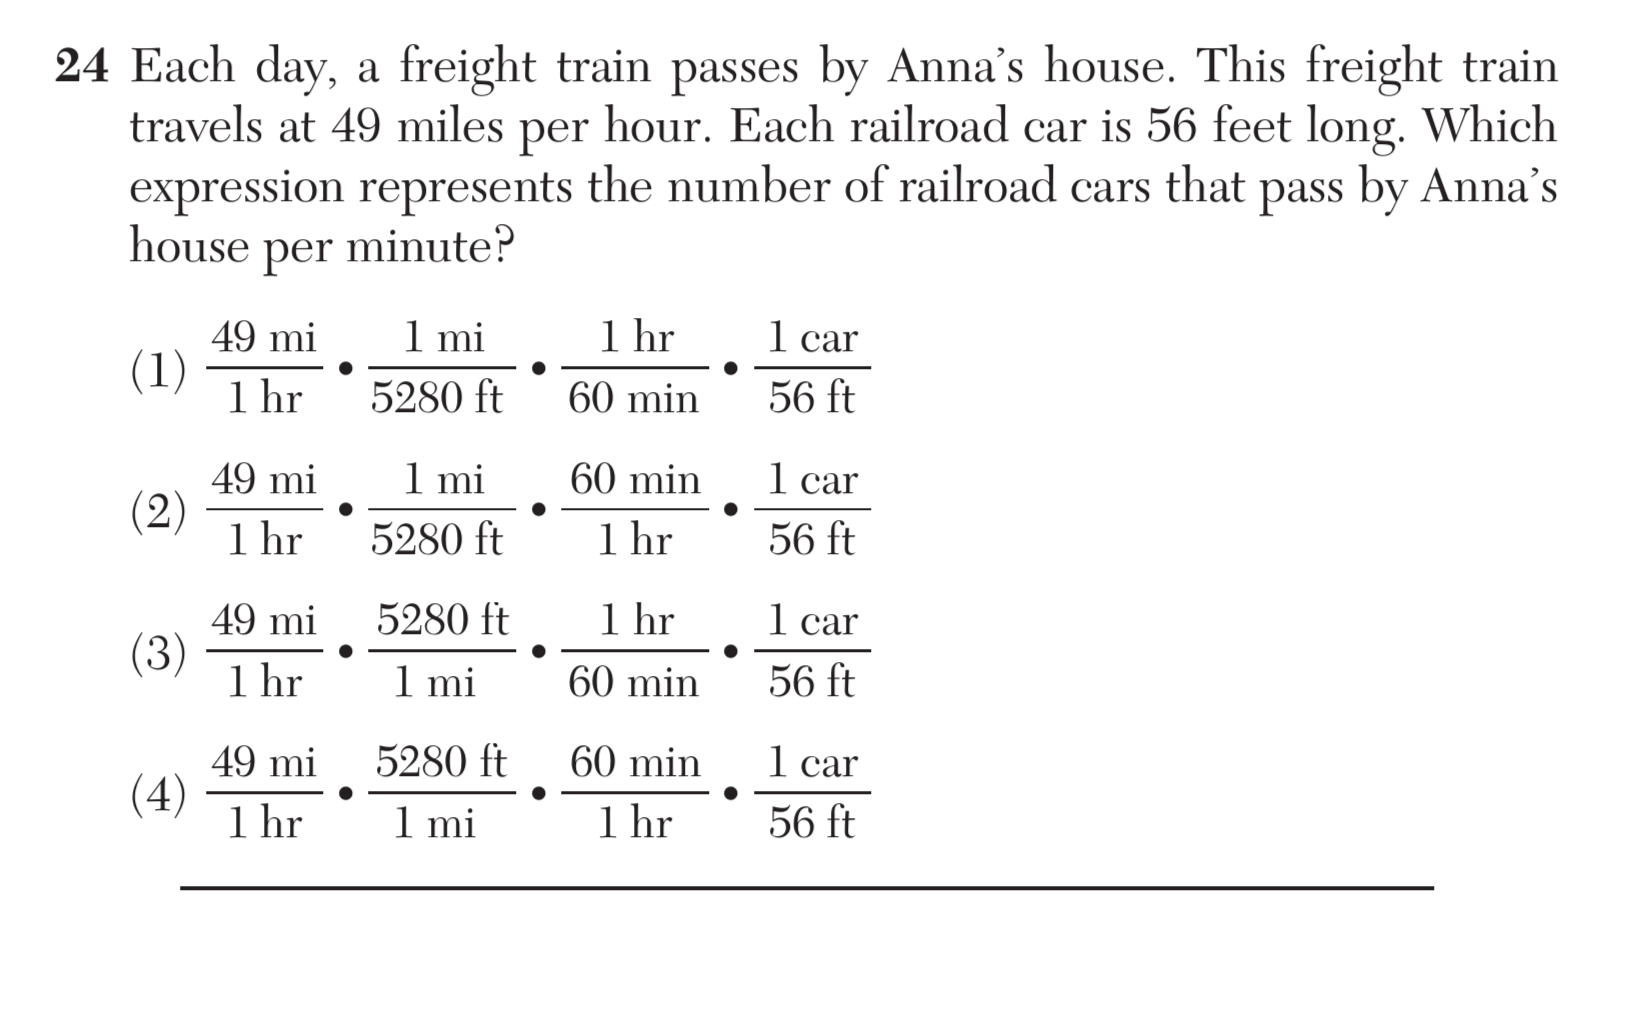
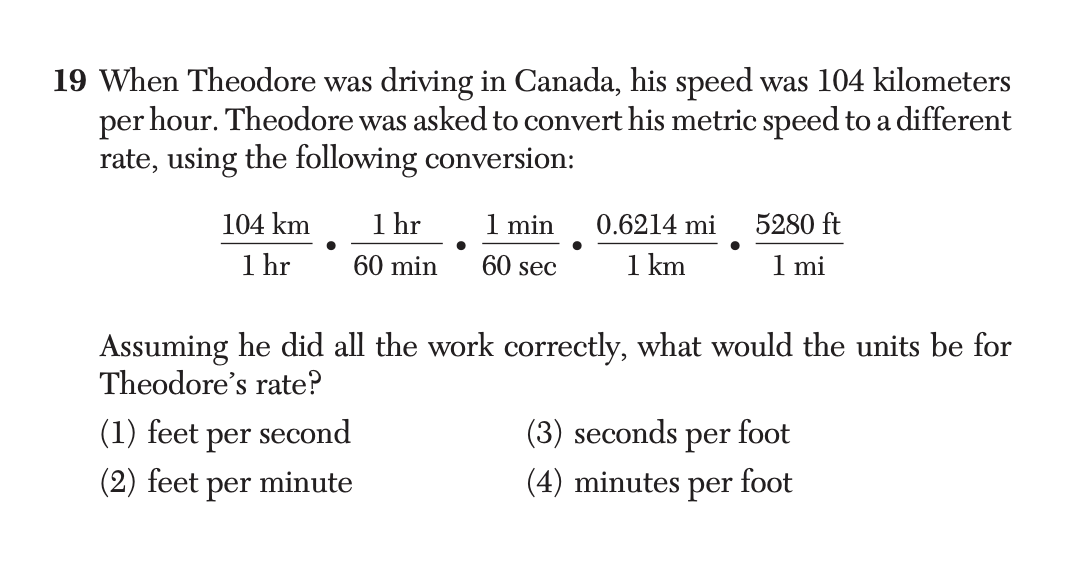
HSN-Q.A.15 questions
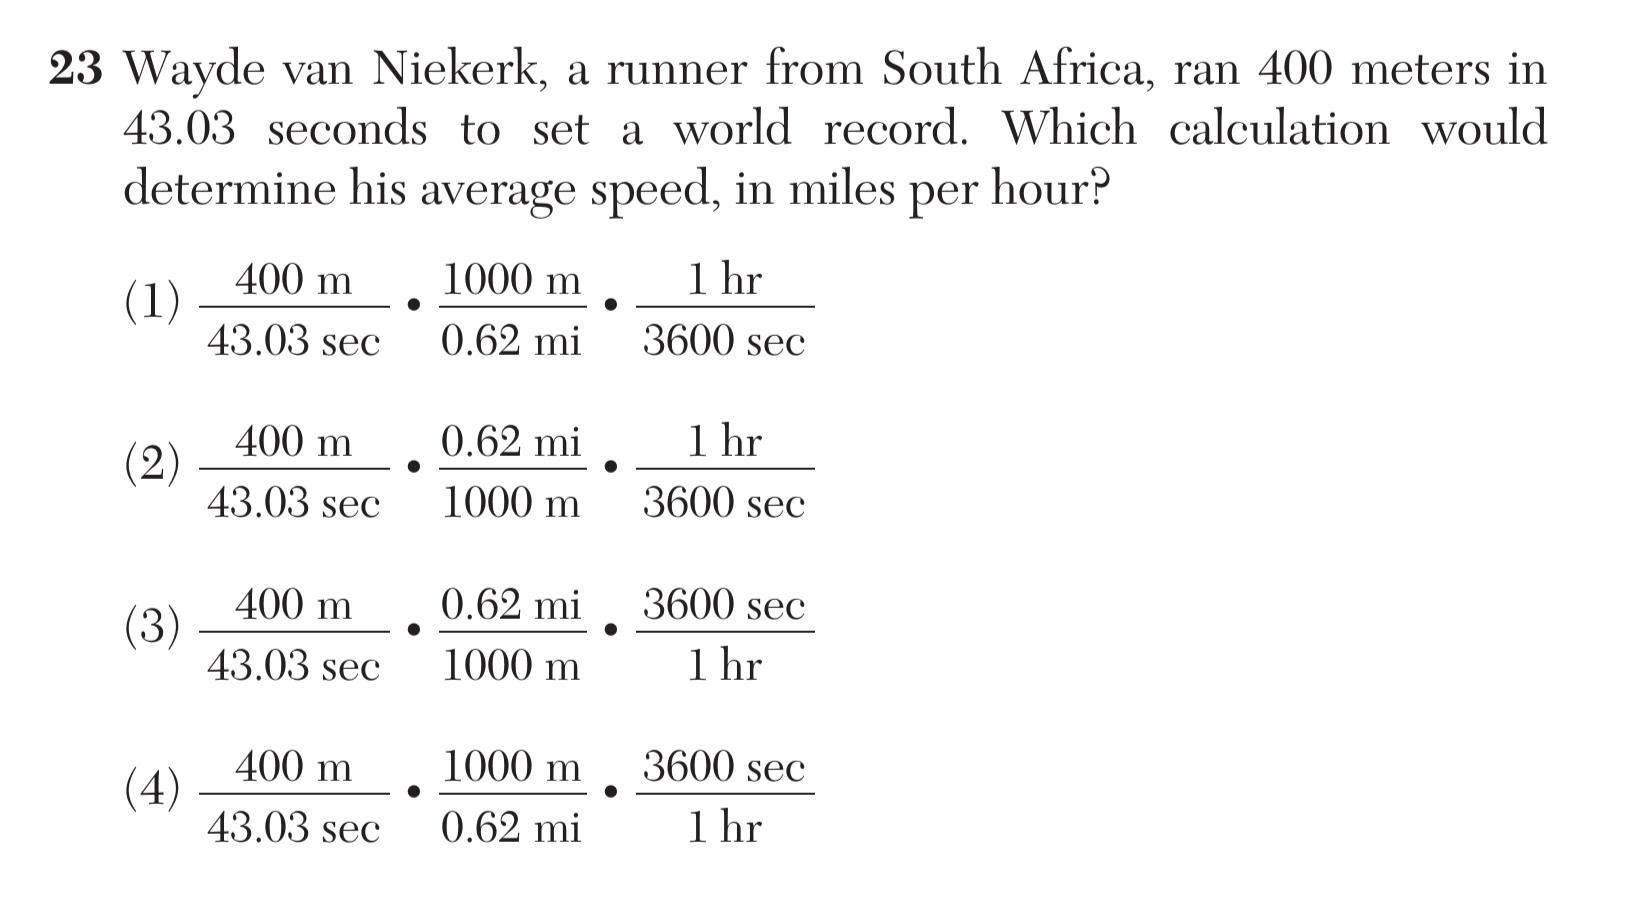
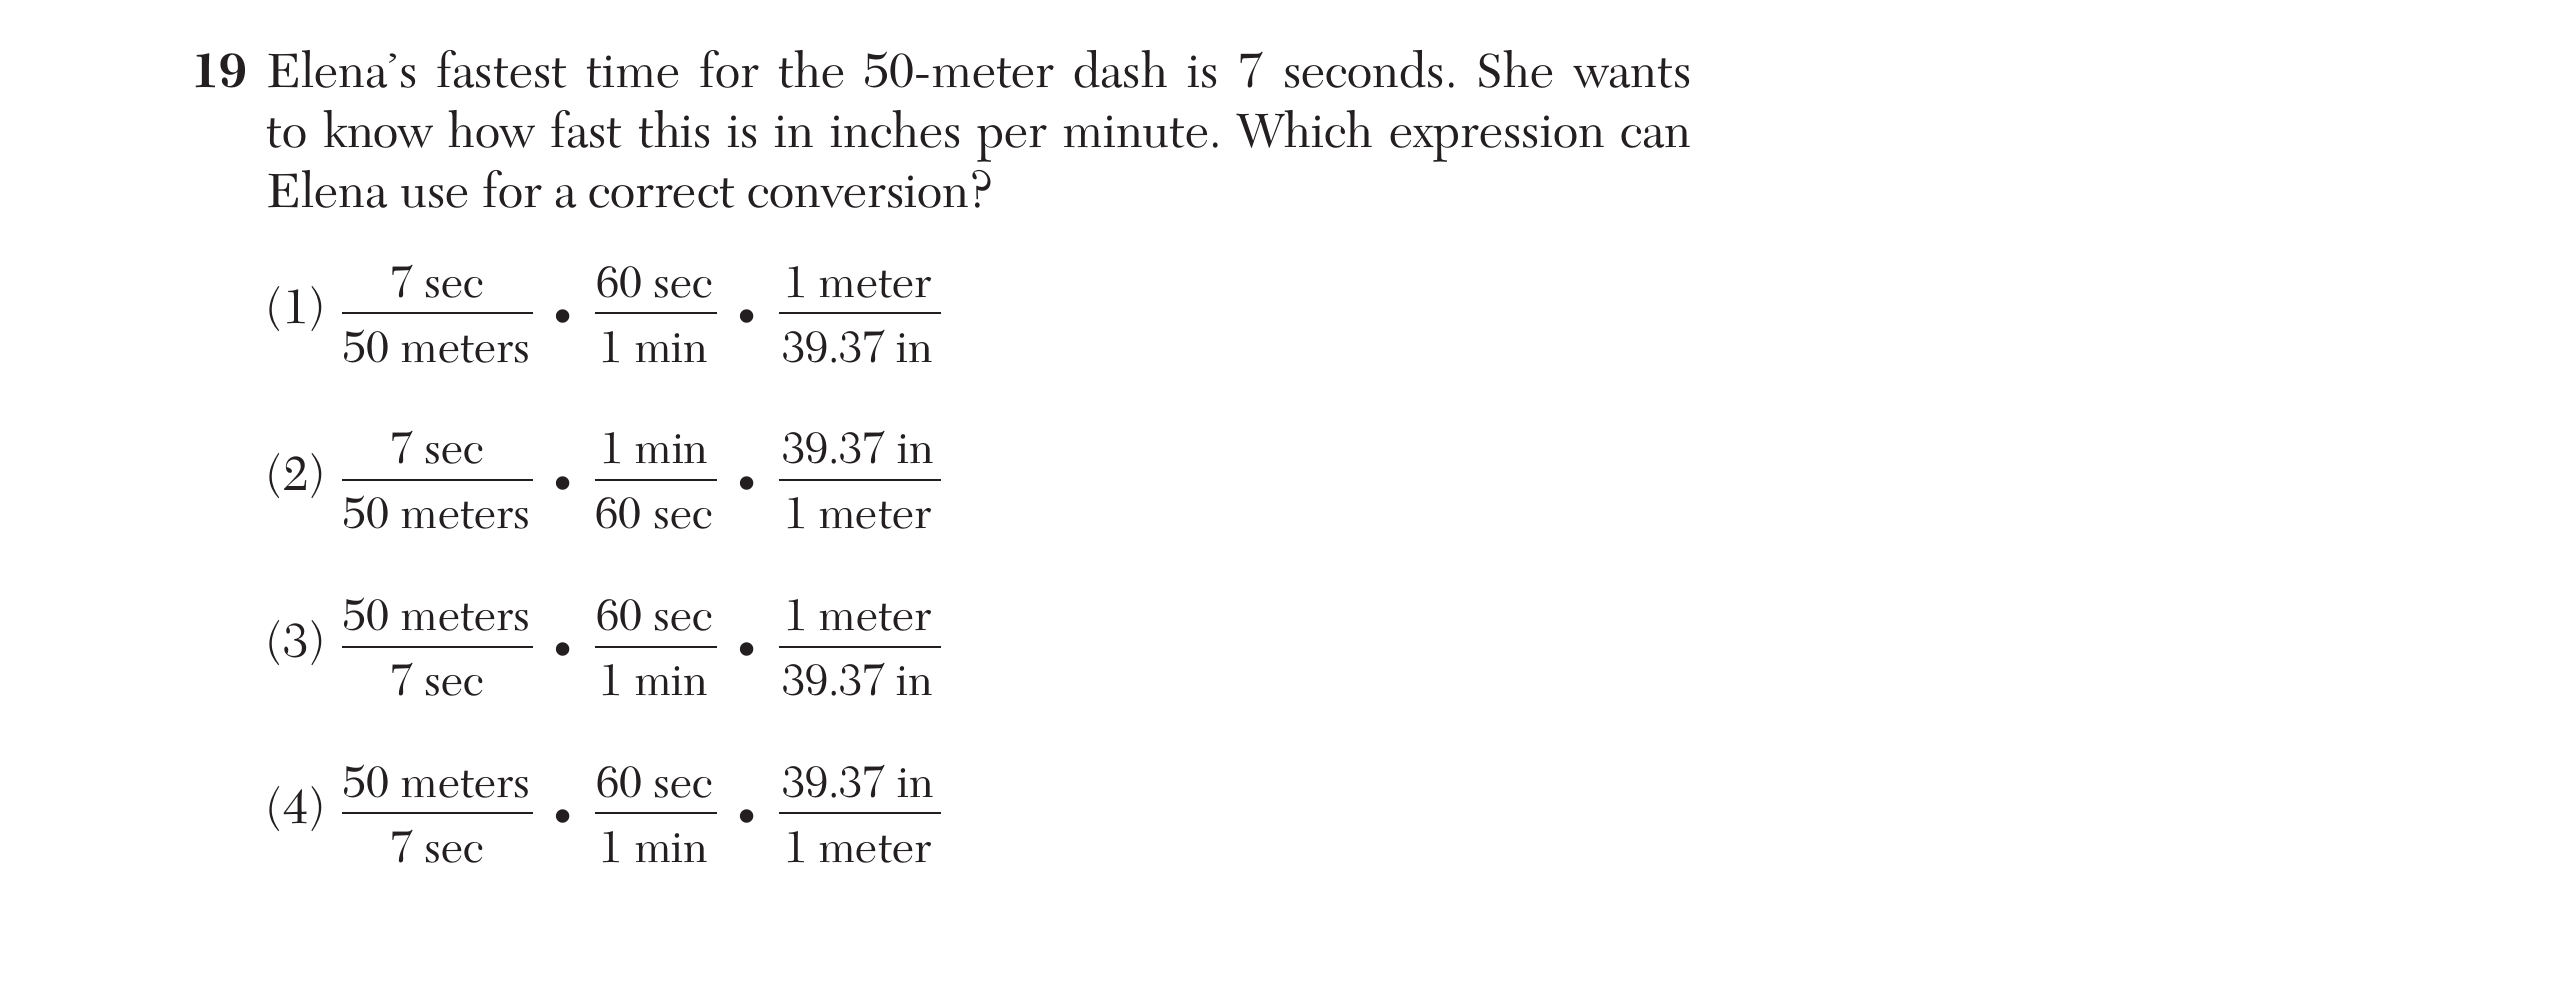
Select quantities and use units as a way to: i) interpret and guide the solution of multi-step problems; ii) choose and interpret units consistently in formulas; and iii) choose and interpret the scale and the origin in graphs and data displays.
F-BF.11 question
Write a function that describes a relationship between two quantities.
F-LE.16 questions
F-LE.21 question
HSS-ID.B.6.a
Represent bivariate data on a scatter plot, and describe how the variables' values are related.
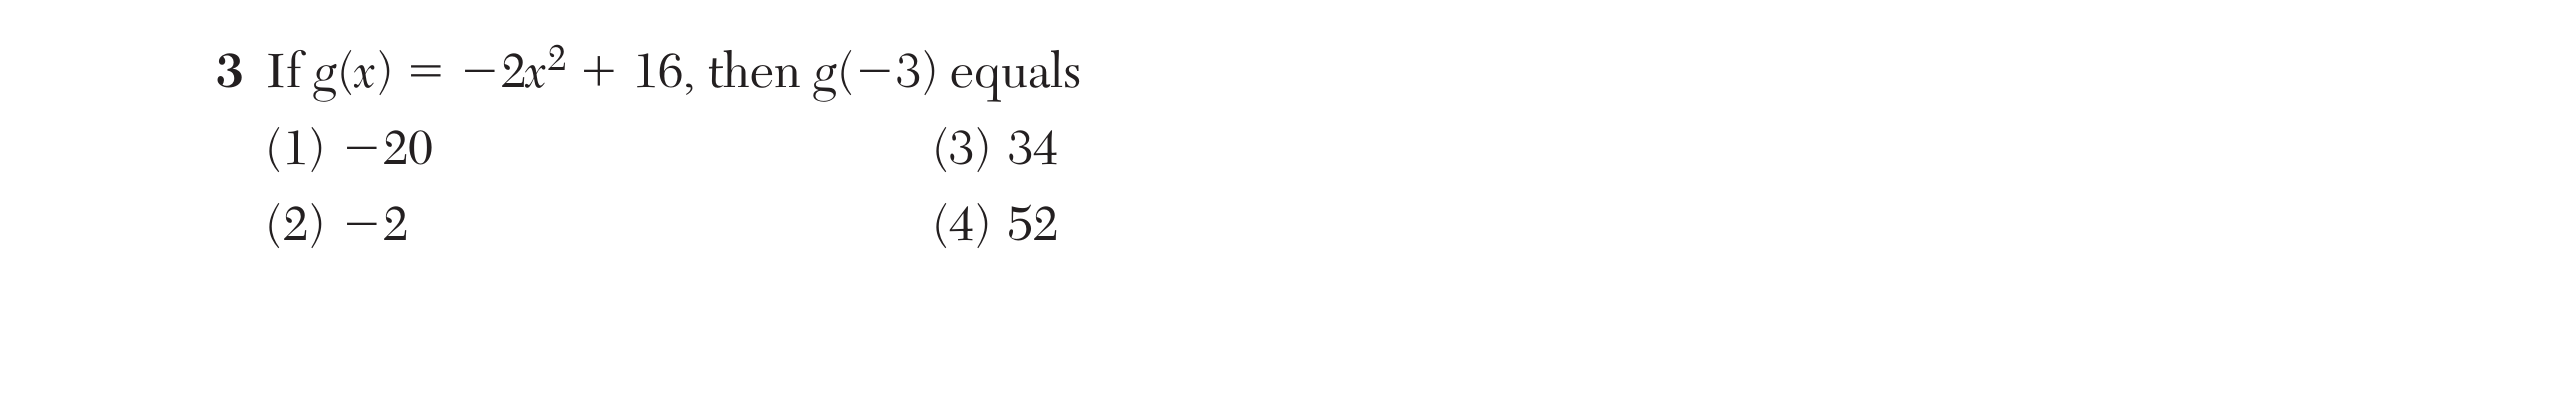
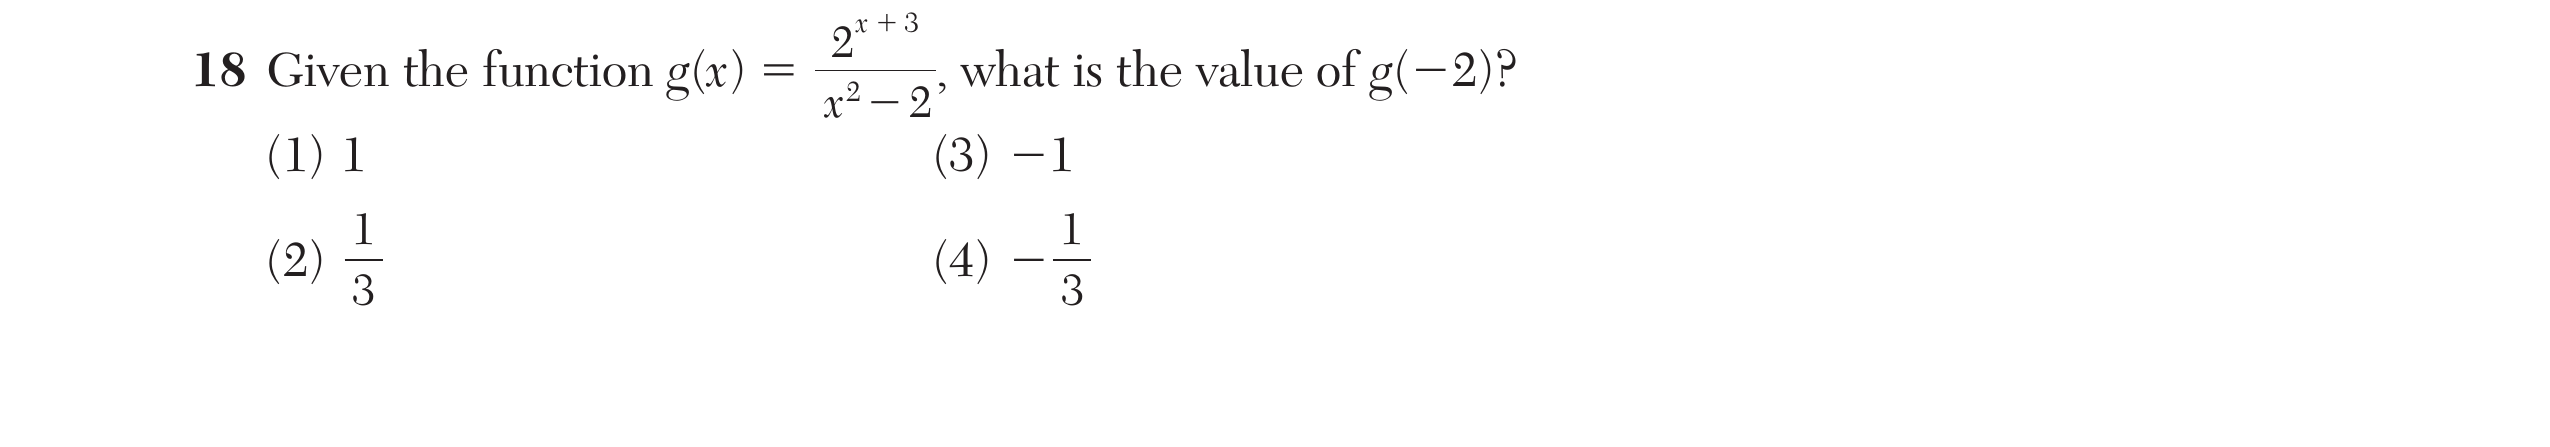
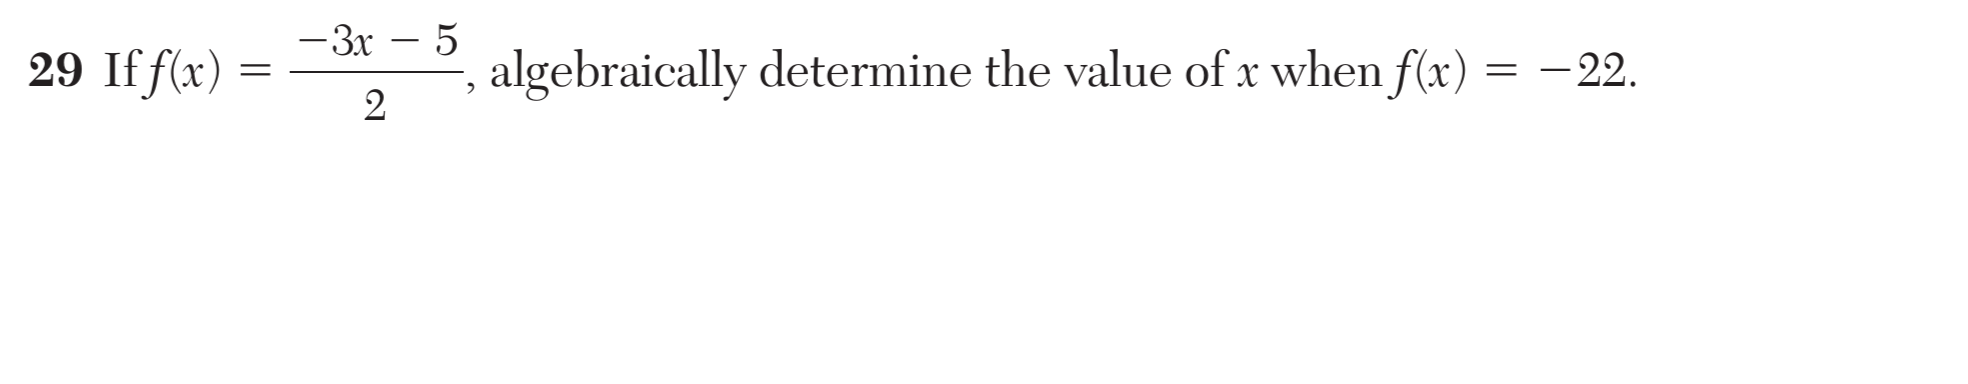
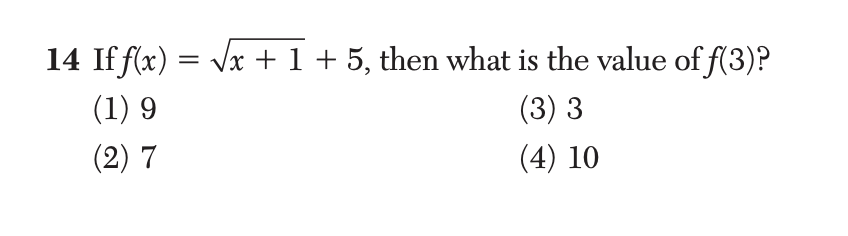
F-IF.25 questions
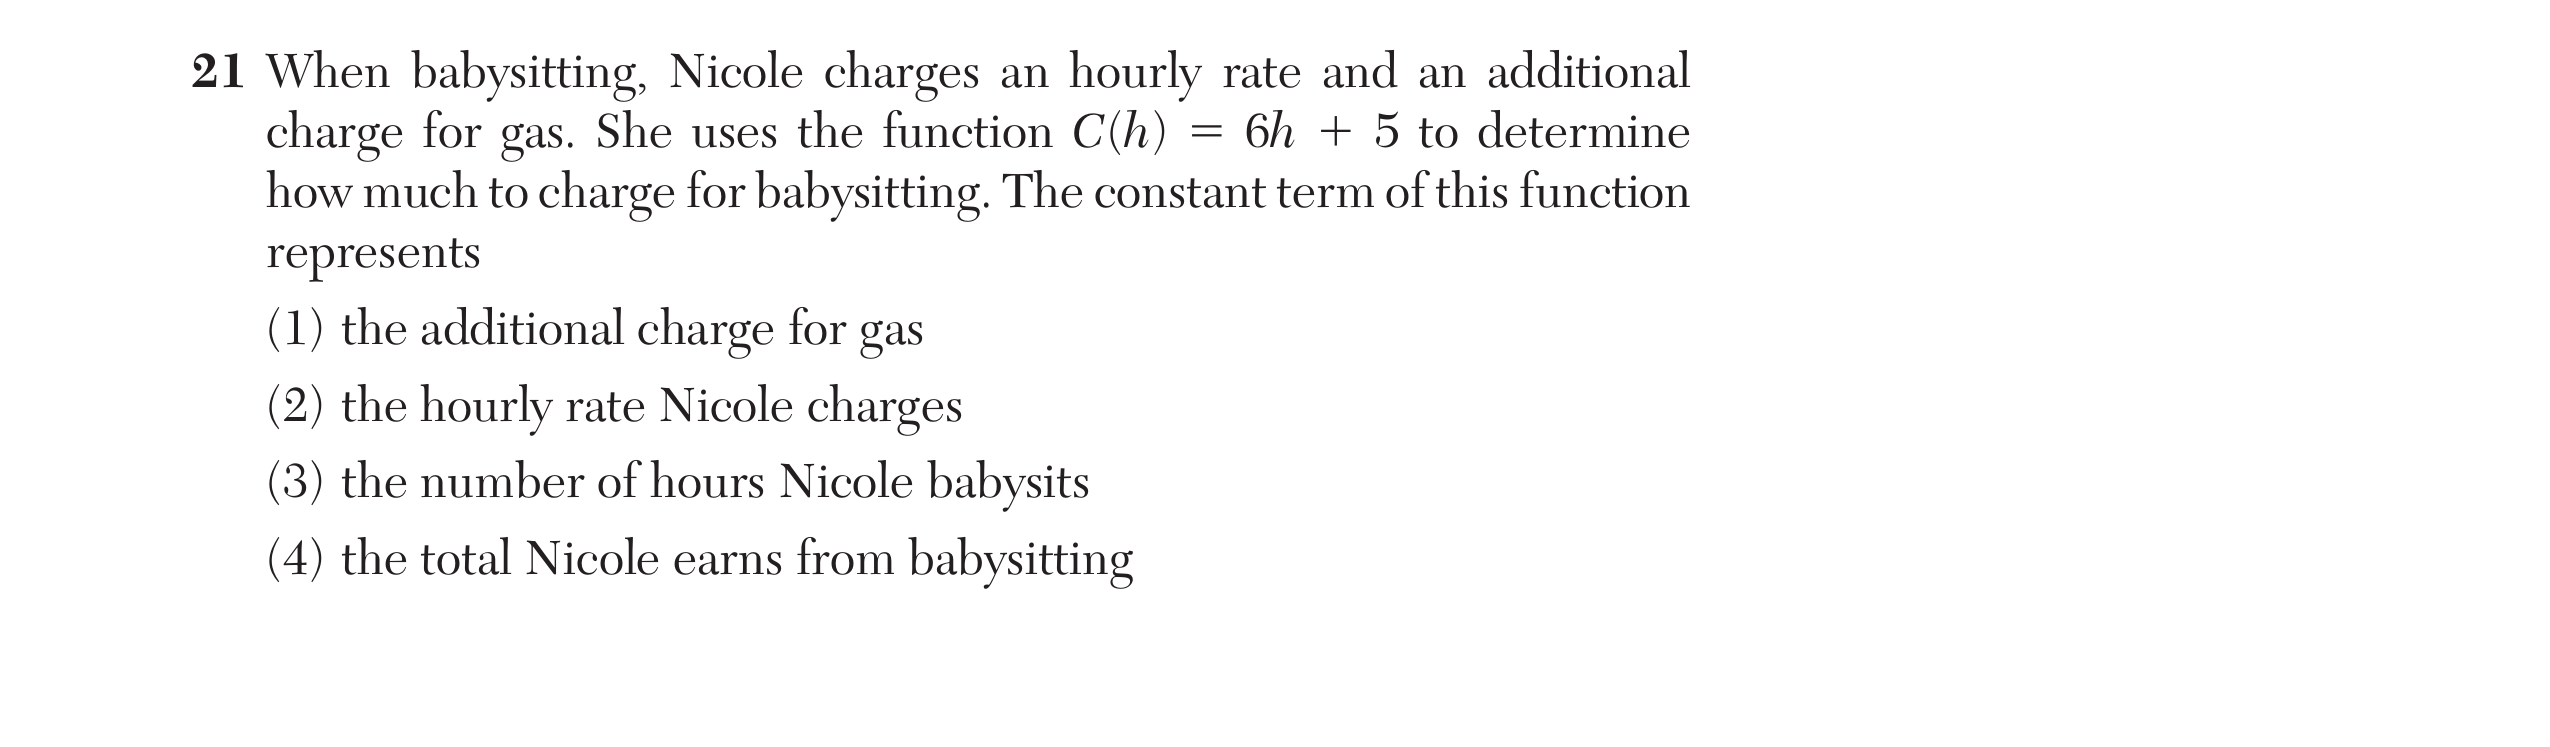
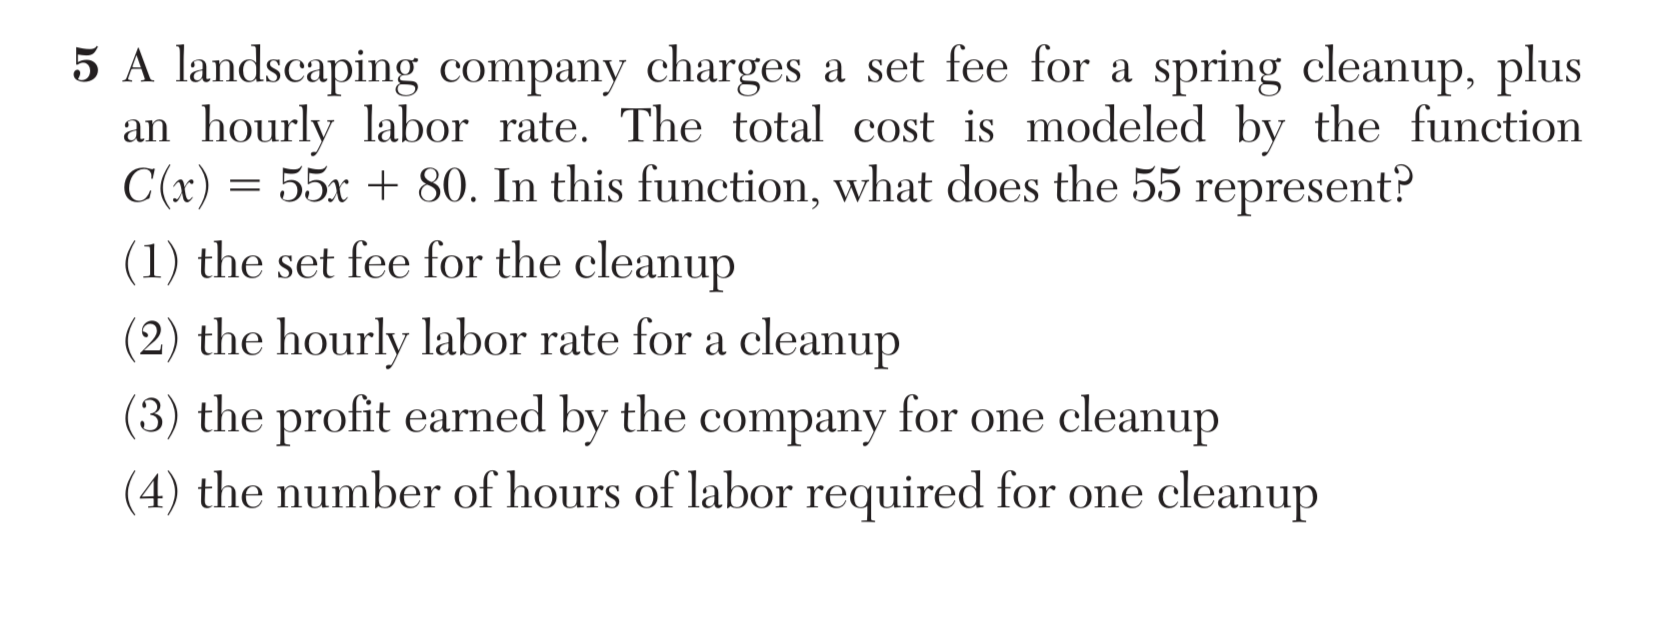
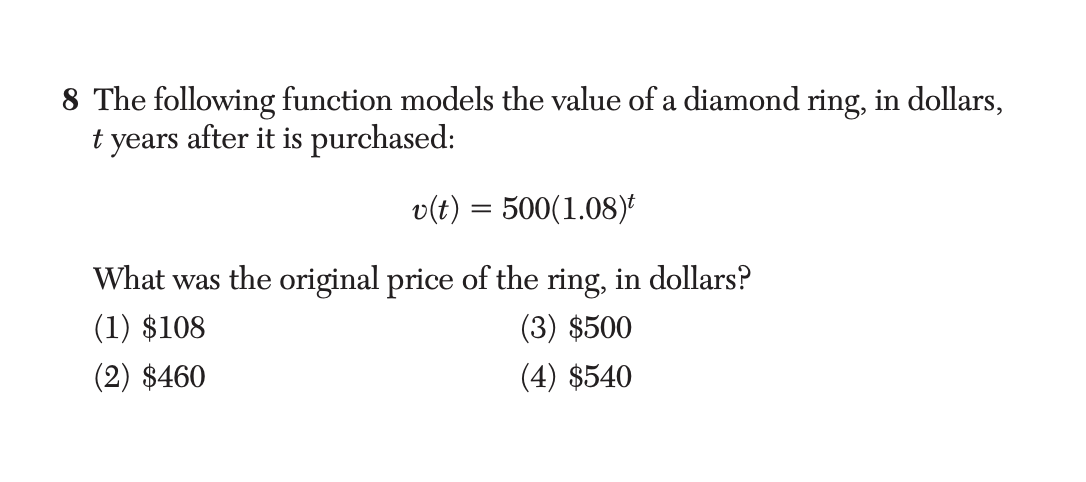
Use function notation, evaluate functions for inputs in their domains, and interpret statements that use function notation in terms of a context.
F-IF.45 questions
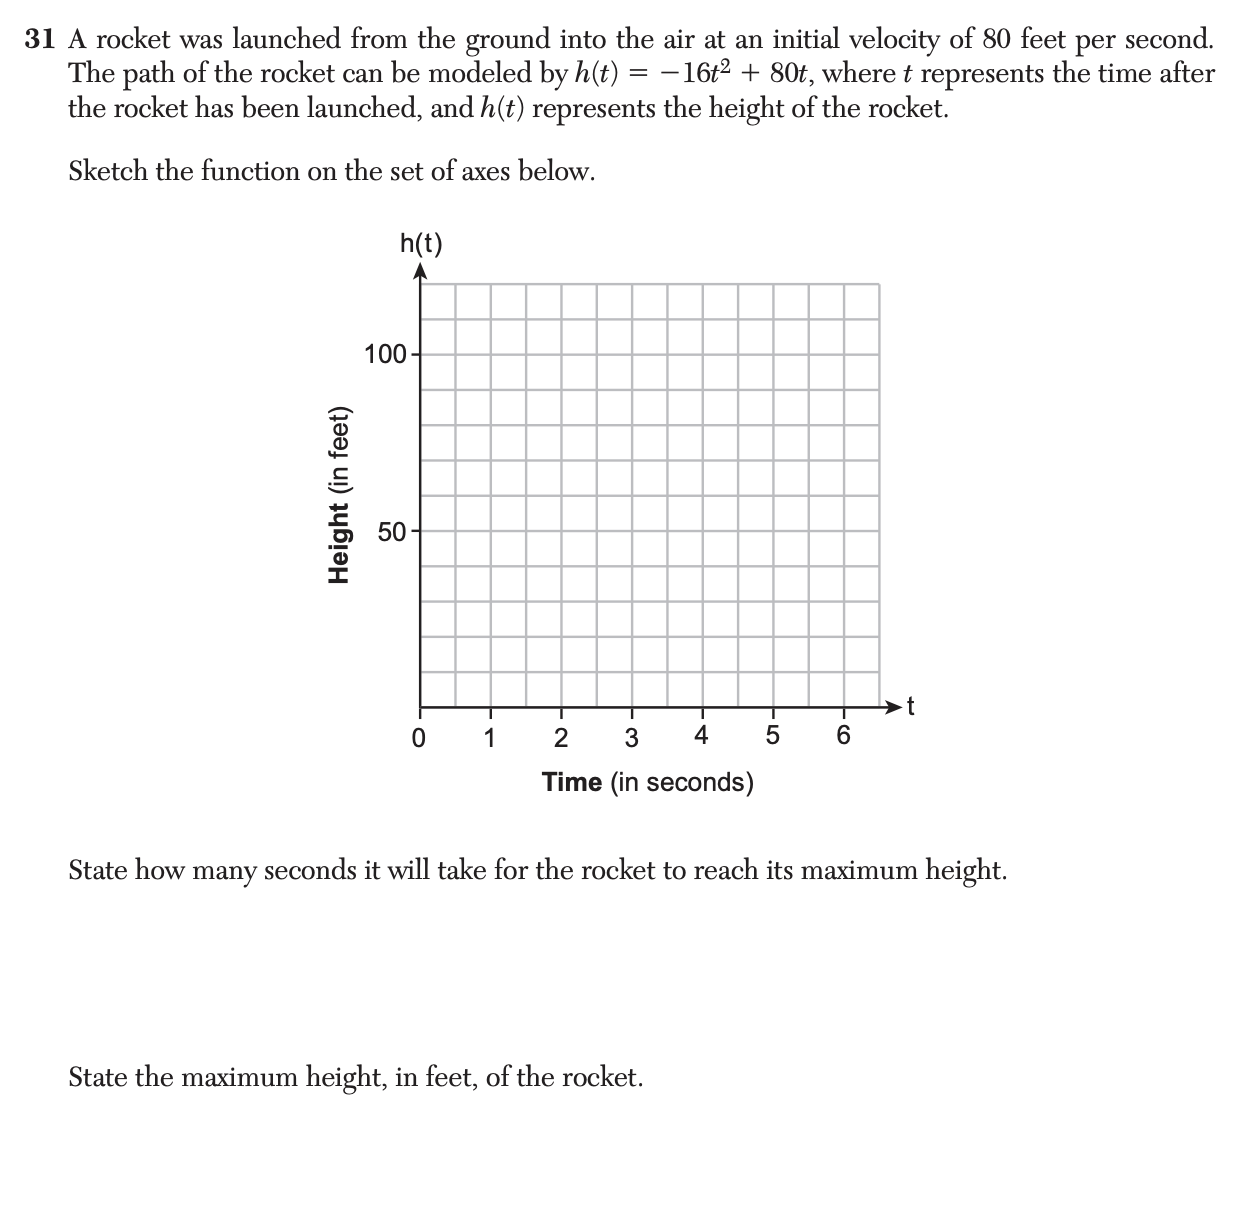
For a function that models a relationship between two quantities: i) interpret key features of graphs and tables in terms of the quantities; and ii) sketch graphs showing key features given a verbal description of the relationship.
F-LE.1.c
No additional information available.
F-LE.53 questions
HSN-Q.A.3
Choose a level of accuracy appropriate to limitations on measurement and context when reporting quantities.
F-IF.52 questions
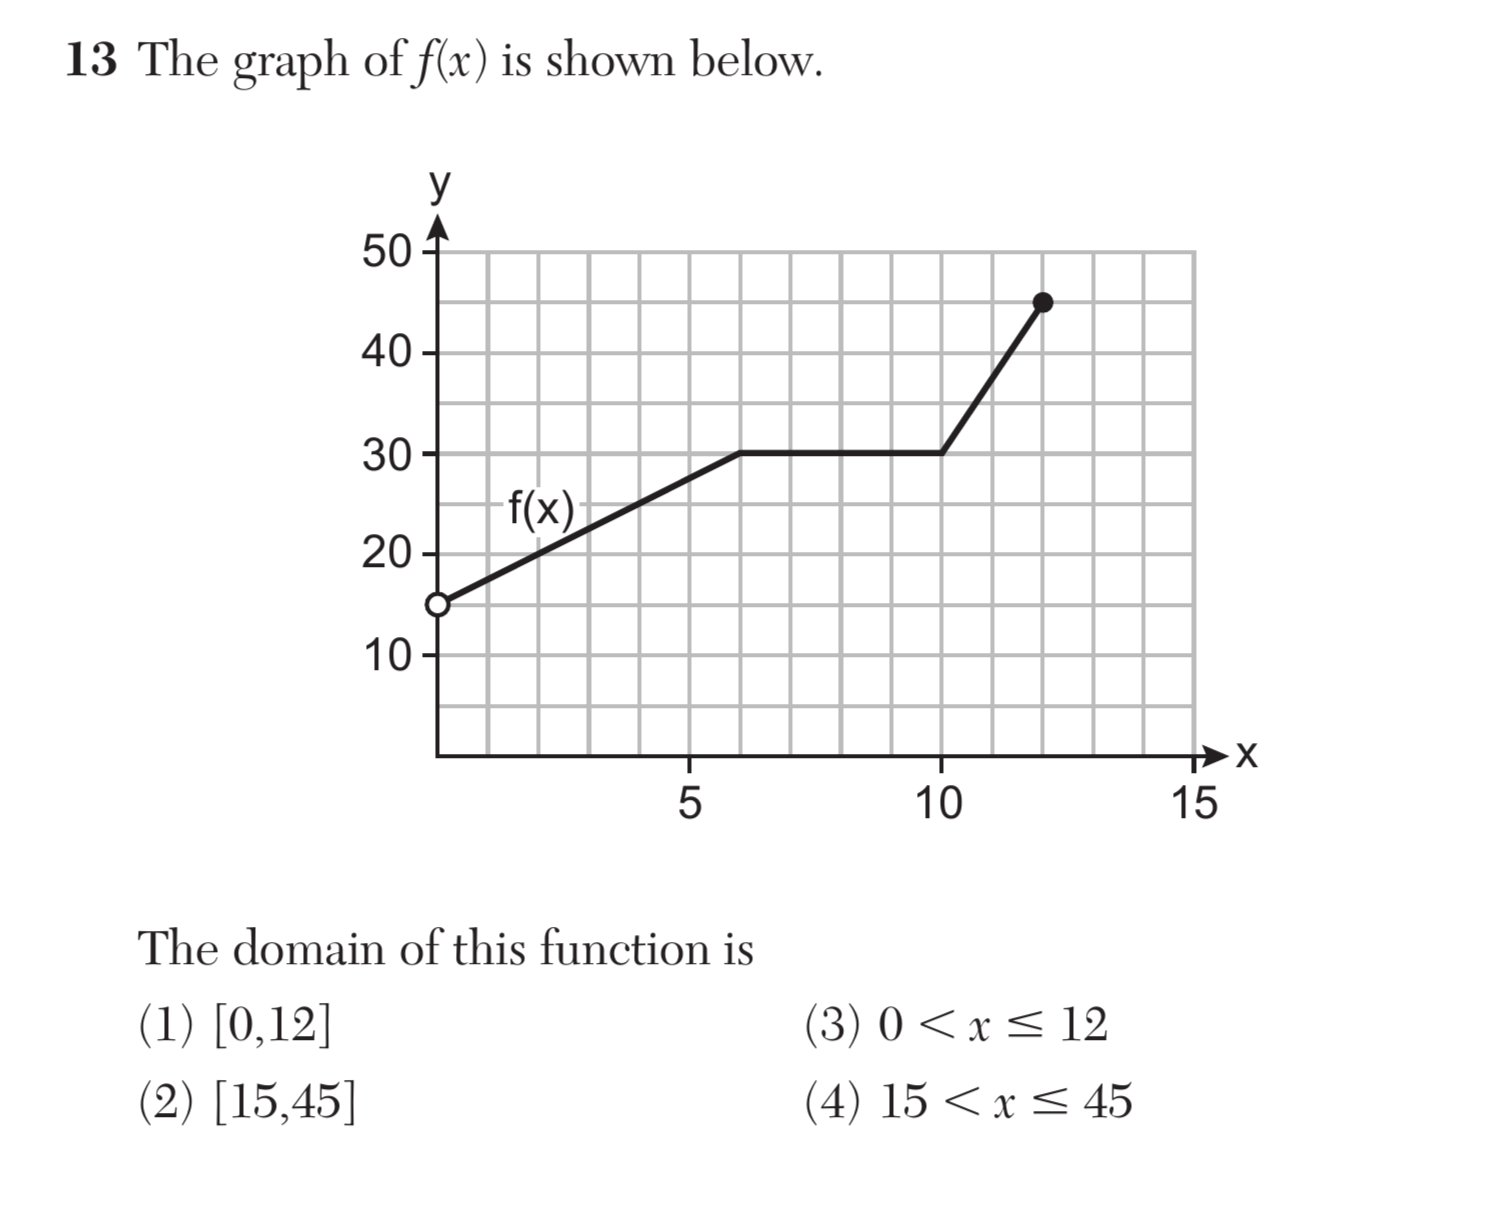
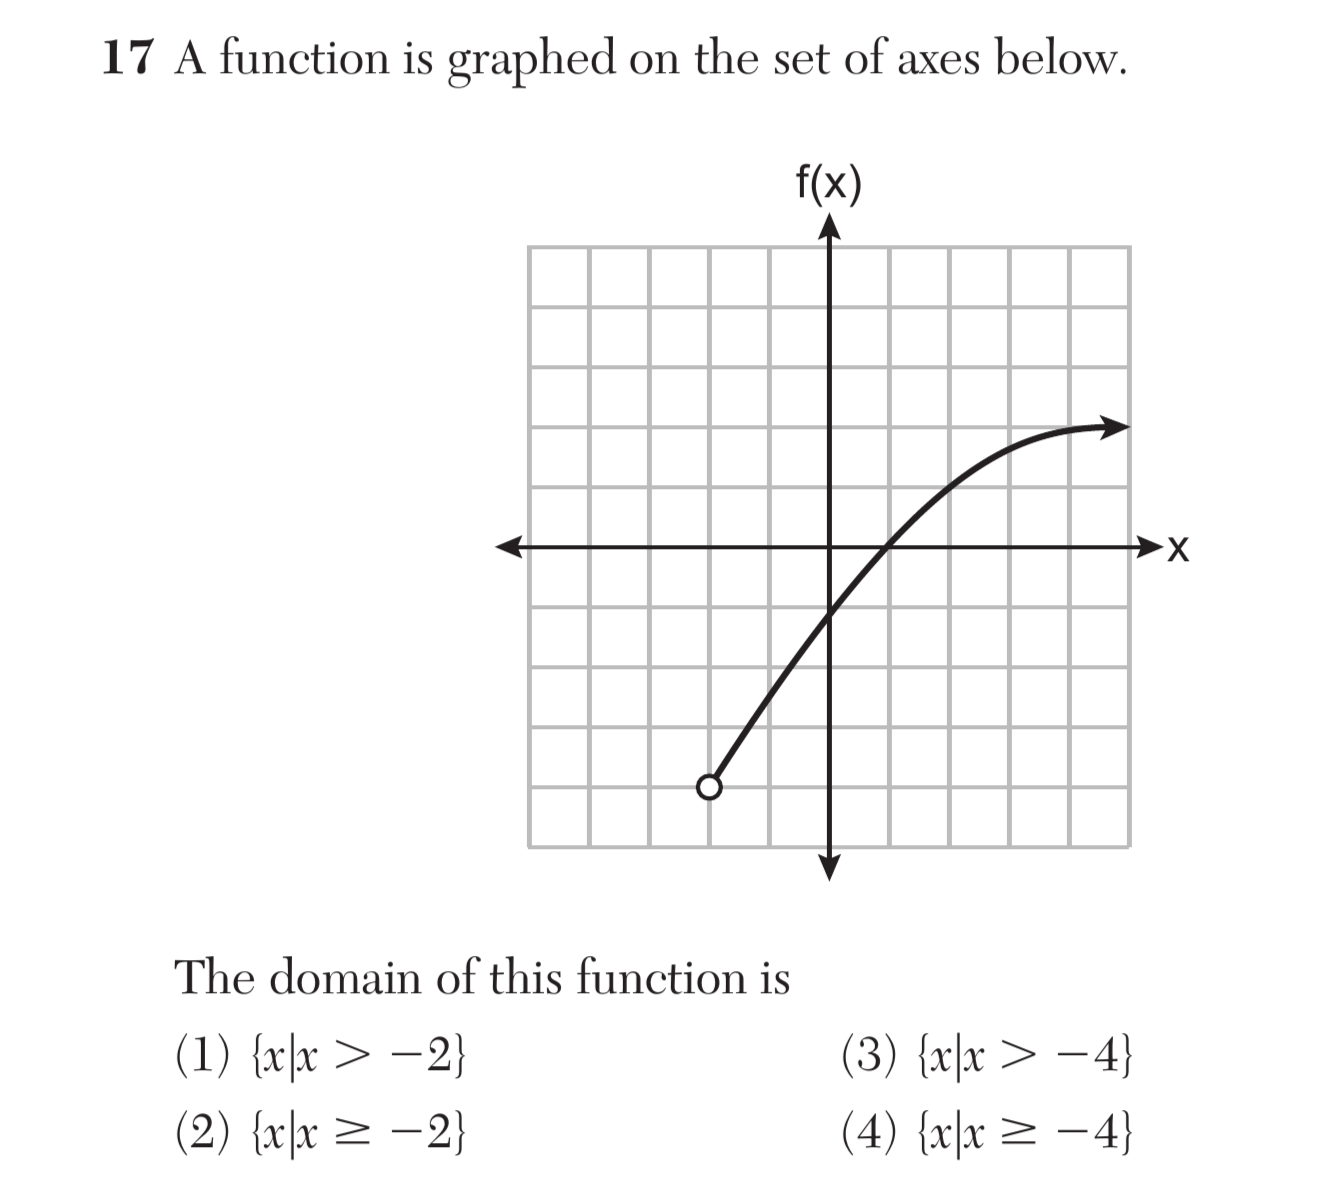
Determine the domain of a function from its graph and, where applicable, identify the appropriate domain for a function in context.