Exponential Situations as Functions
Student Summary
The situations we have looked at that are characterized by exponential change can be seen as functions. In each situation, there is a quantity—an independent variable—that determines another quantity—a dependent variable. They are functions because any value of the independent variable that makes sense corresponds to only one value of the dependent variable. Functions that describe exponential change are called exponential functions.
For example, suppose t represents time in hours, and p is a bacteria population t hours after the bacteria population was measured. For each time t, there is only one value for the corresponding number of bacteria, so we can say that p is a function of t and we can write this as p=f(t).
If there were 100,000 bacteria at the time it was initially measured and the population decreases so that 51 of it remains after each passing hour, we can use function notation to model the bacteria population:
f(t)=100,000⋅(51)t
Notice the expression in the form of a⋅bt (on the right side of the equation) is the same as in previous equations that we wrote to represent situations characterized by exponential change.
Visual / Anchor Chart

Standards
HSF-IF.A
No additional information available.
F-IF.1
Understand that a function from one set (called the domain) to another set (called the range) assigns to each element of the domain exactly one element of the range.
F-IF.B
No additional information available.
F-IF.25 questions
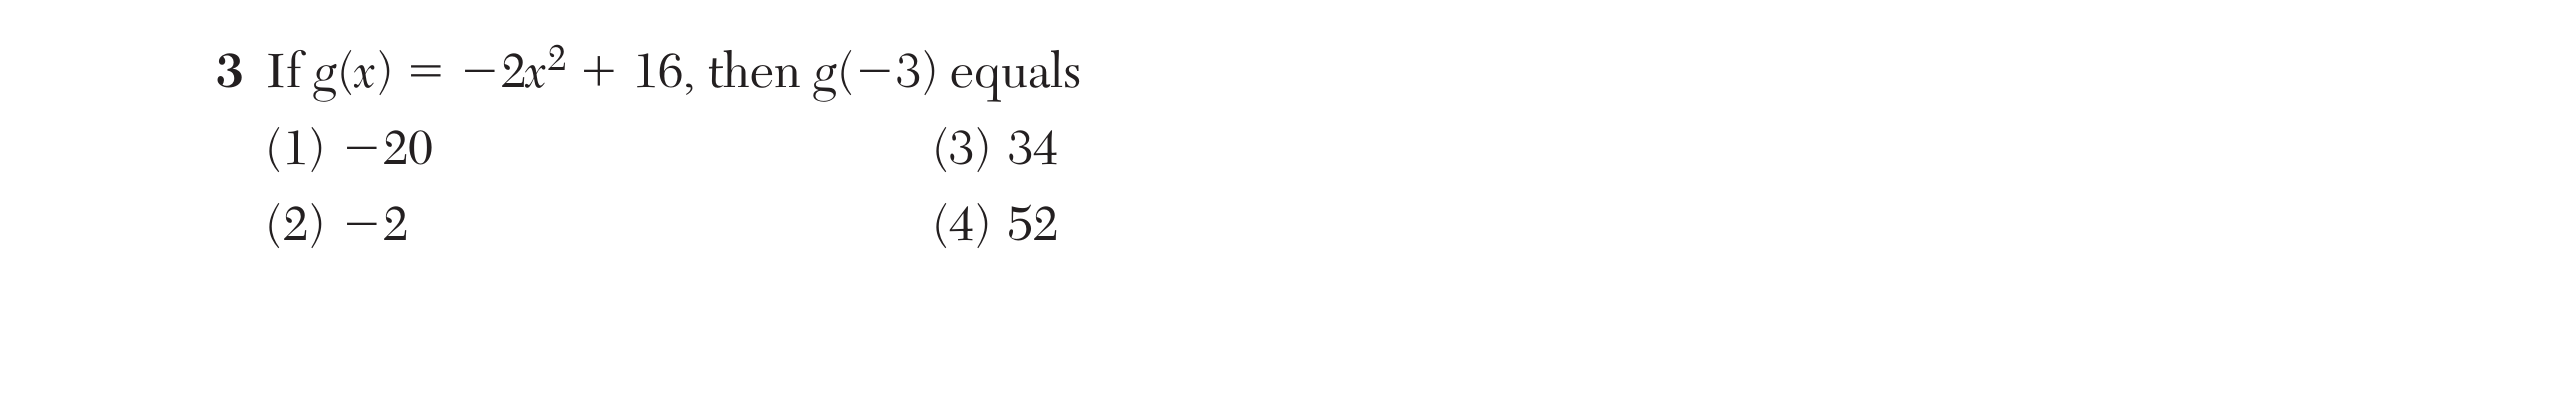
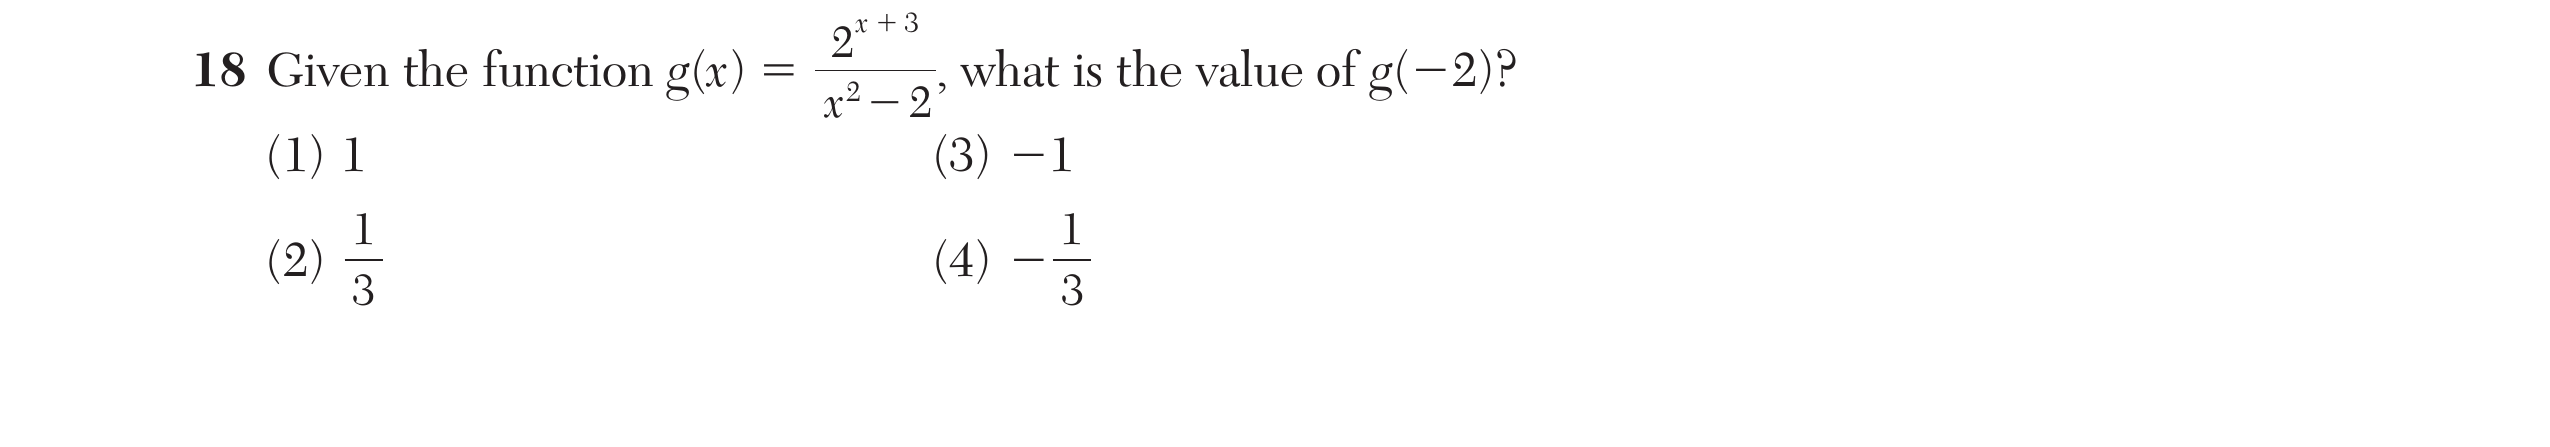
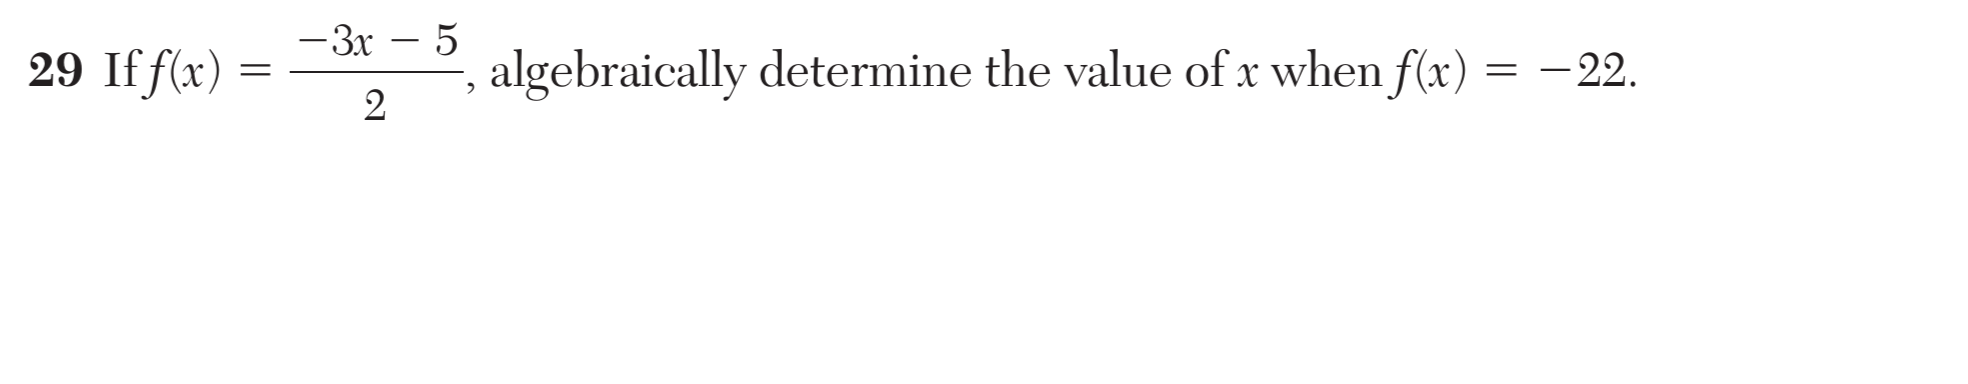
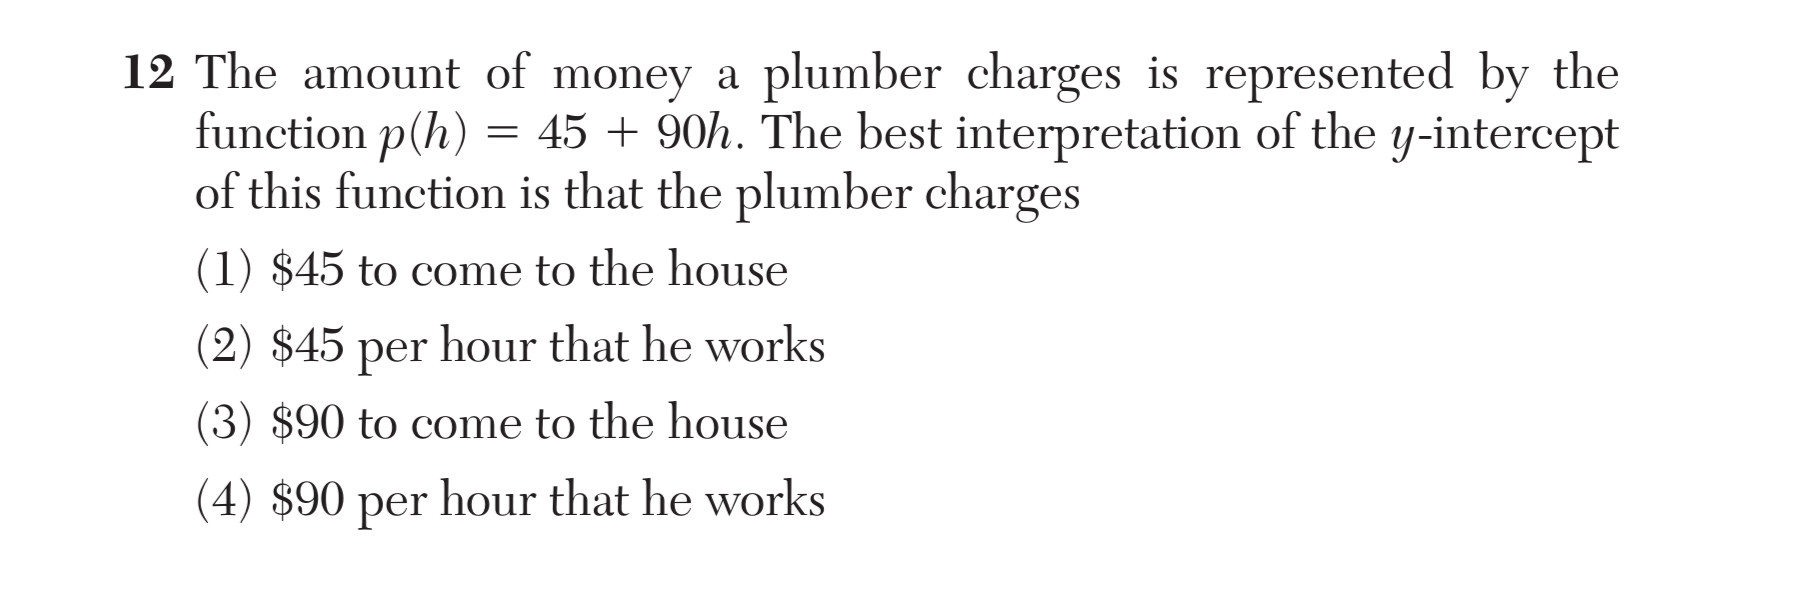
Use function notation, evaluate functions for inputs in their domains, and interpret statements that use function notation in terms of a context.

F-IF.75 questions
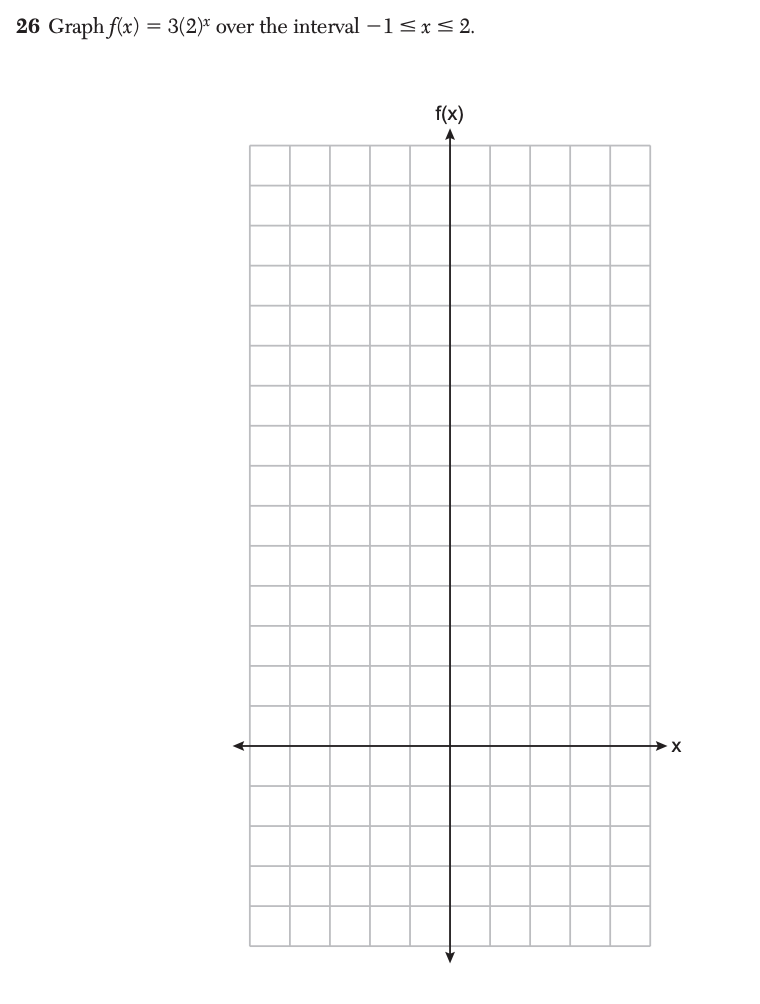
Graph functions and show key features of the graph by hand and by using technology where appropriate.
F-LE.21 question
F-IF.52 questions
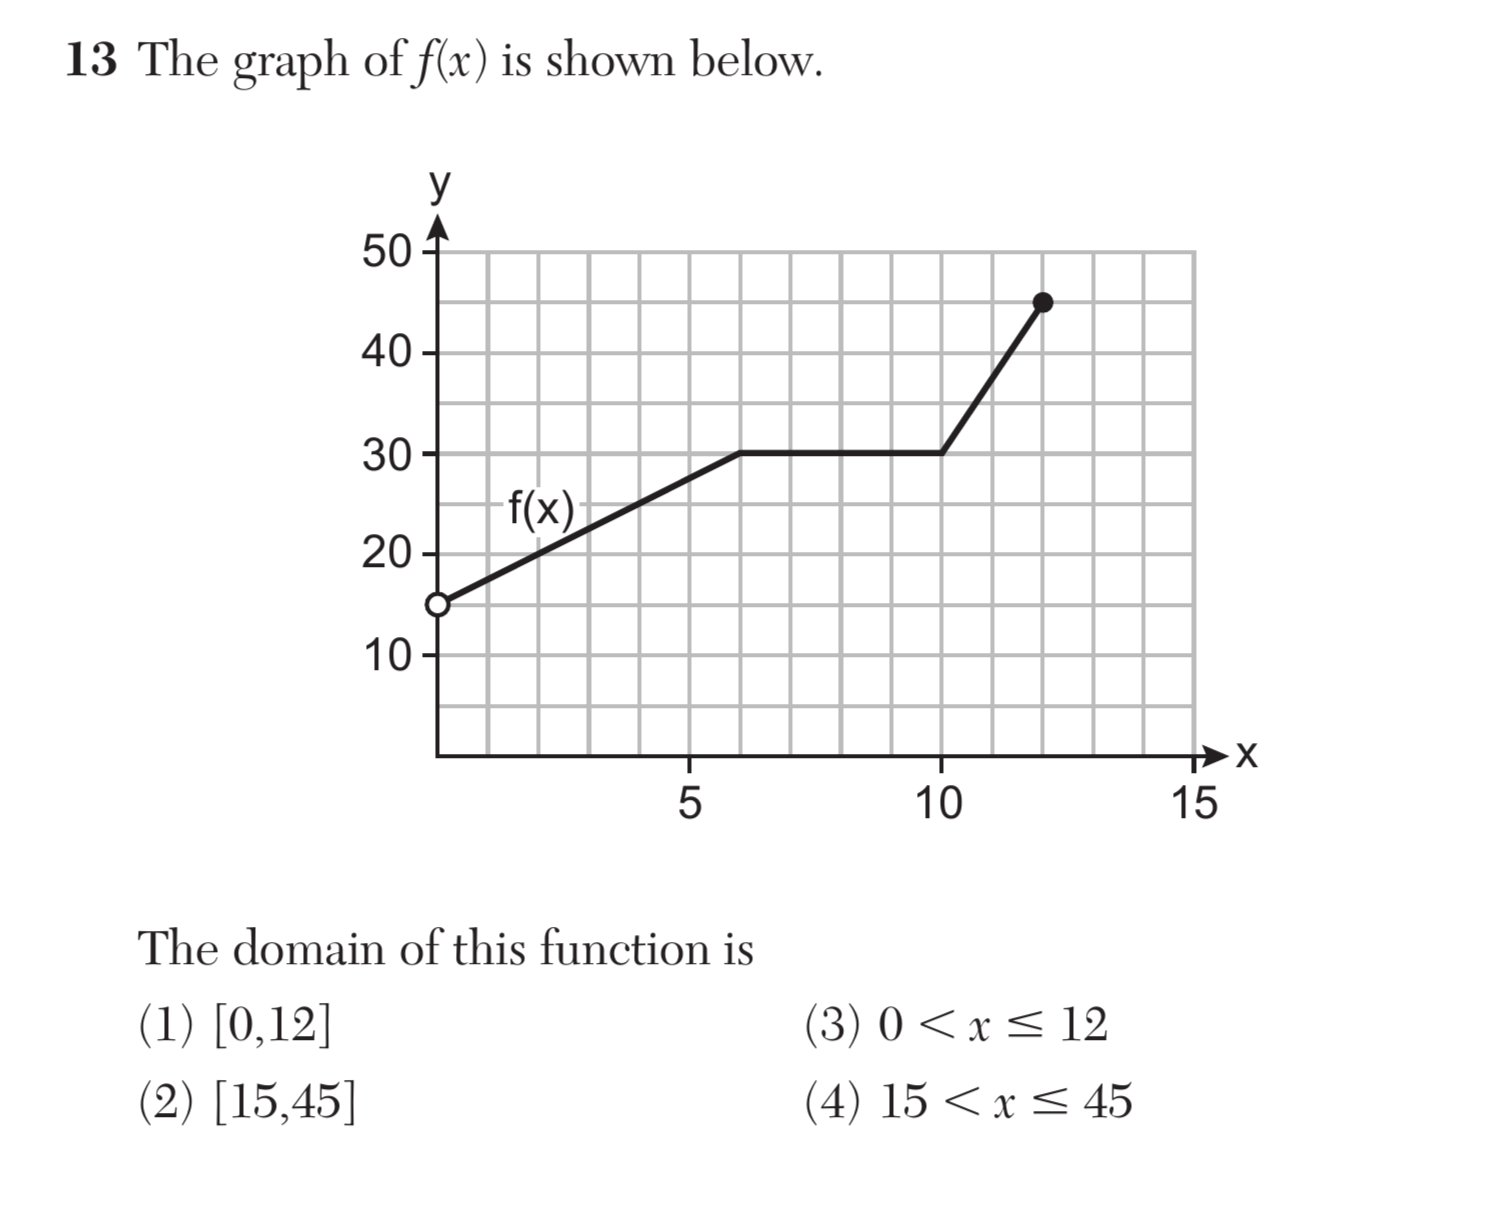
Determine the domain of a function from its graph and, where applicable, identify the appropriate domain for a function in context.
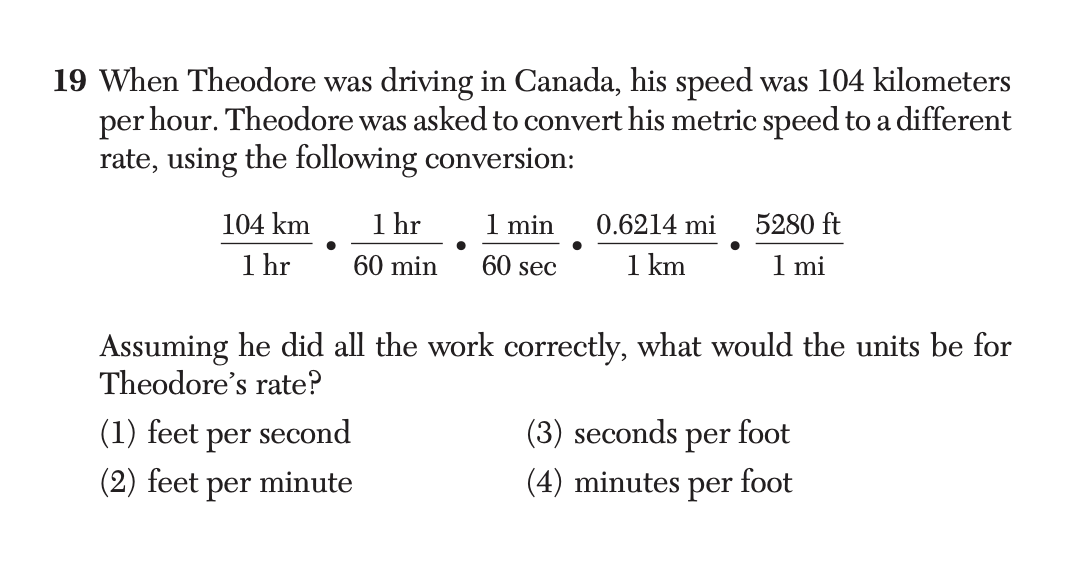
HSN-Q.A.15 questions
Select quantities and use units as a way to: i) interpret and guide the solution of multi-step problems; ii) choose and interpret units consistently in formulas; and iii) choose and interpret the scale and the origin in graphs and data displays.